


Enhanced debugging for Stimulus
This article was originally published on Rails Designer Stimulus has a basic debug mode that shows if Stimulus is running and lists which controller are initialized and connected. But when you work with Stimulus controllers often, there's a need to see a bit more detail, without manually expecting the DOM versus your controller's logic. So I explored a new idea and add it as a new FX to Stimulus FX: enableDebug. This is what it gives you: It is easy to set up: // app/javascript/controllers/application.js +import { enableDebug } from "stimulus-fx" -const application = Application.start() +const application = enableDebug(Application.start()) Then you can enable debugging per controller like so: export default class extends Controller { + static debug = true + // … } I added this mostly as an experimental feature to see if it was possible and with releasing it, hopefully inspire someone from you, to expand this even more. I have some ideas myself, but don't want to influence you. How does it work The code for this is surprisingly simple. It creates an enableDebug function that takes application as an argument (as seen from the usage: enableDebug(Application.start())). import { debuggable } from "./debuggable"; import { initialize } from "./enableDebug/initialize"; import { values } from "./enableDebug/values"; import { targets } from "./enableDebug/targets"; export function enableDebug(application) { const debugFeatures = [ initialize, targets, values ]; return debuggable(application, { with: debugFeatures }); } See how readable it is? “Return debuggable application with (debug) features”. Then in debuggable it loops over the given features: features.forEach(feature => feature(identifier, callbacks)); invoking the feature with the identifier and the callbacks (the lifecycle methods). The initialize functions is simple: export function initialize(identifier, callbacks) { const debugCallback = ({ for: lifecycle }) => ({ log(context) { console.group(`#${lifecycle}`); console.log("details:", { application: context.application, identifier, controller: context, element: context.element }); console.groupEnd(); } }); ["initialize", "connect", "disconnect"].forEach(lifecycle => { callbacks[lifecycle].push(function() { debugCallback({ for: lifecycle }).log(this); }); }); } Here, too, I'd like to highlight the readability: “debug callback for lifecycle”. Nice, right? The values and targets logic has a bit more to it, let's look at src/enableDebug/values.js: export function values(identifier, callbacks) { callbacks.connect.push(function() { logValues({ on: this.element, for: identifier }); }); } function logValues({ on: element, for: identifier }) { const values = allValues(element, identifier); if (Object.keys(values).length === 0) return; console.group("Values"); console.table(values); console.groupEnd(); } function allValues(element, identifier) { const prefix = `${identifier}-`; const dataPrefix = "data-"; const valueSuffix = "-value"; // logic to get values from the element/identifier } It pushes the result from logValues, which is just the grouped console.table result onto the connect array that is defined in src/debuggable.js (same is happening for the targets): export function debuggable(application, { with: features }) { // … const callbacks = { initialize: [], connect: [], disconnect: [] }; // … } Still in src/debuggable.js these functions are then invoked within the controller's connect (and other lifecycle methods): export function debuggable(application, { with: features }) { // … controller.prototype.connect = function() { callbacks.connect.forEach(hook => hook.call(this)); // … }; } And that's all there is to it. I hope this short tour will help if you are interested in exploring this feature more. Maybe with enough weight and interest behind it, it can even be ported into Stimulus it self. Let me know if you have any questions.
This article was originally published on Rails Designer
Stimulus has a basic debug mode that shows if Stimulus is running and lists which controller are initialized and connected. But when you work with Stimulus controllers often, there's a need to see a bit more detail, without manually expecting the DOM versus your controller's logic.
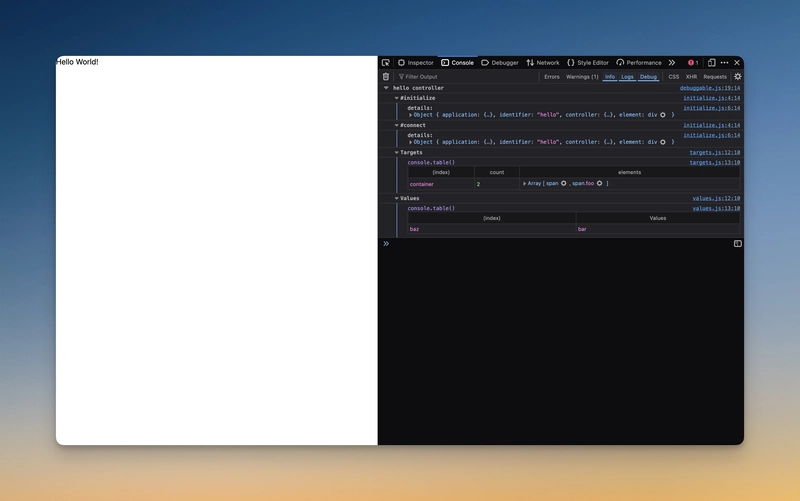
So I explored a new idea and add it as a new FX to Stimulus FX: enableDebug. This is what it gives you:
It is easy to set up:
// app/javascript/controllers/application.js

+import { enableDebug } from "stimulus-fx"

-const application = Application.start()

+const application = enableDebug(Application.start())
Then you can enable debugging per controller like so:
export default class extends Controller {
+  static debug = true
+
// …
}
I added this mostly as an experimental feature to see if it was possible and with releasing it, hopefully inspire someone from you, to expand this even more. I have some ideas myself, but don't want to influence you.
How does it work
The code for this is surprisingly simple. It creates an enableDebug function that takes application as an argument (as seen from the usage: enableDebug(Application.start())).
import { debuggable } from "./debuggable";
import { initialize } from "./enableDebug/initialize";
import { values } from "./enableDebug/values";
import { targets } from "./enableDebug/targets";

export function enableDebug(application) {
  const debugFeatures = [
    initialize,
    targets,
    values
  ];

  return debuggable(application, { with: debugFeatures });
}
See how readable it is? “Return debuggable application with (debug) features”.
Then in debuggable it loops over the given features: features.forEach(feature => feature(identifier, callbacks)); invoking the feature with the identifier and the callbacks (the lifecycle methods). The initialize functions is simple:
export function initialize(identifier, callbacks) {
  const debugCallback = ({ for: lifecycle }) => ({
    log(context) {
      console.group(`#${lifecycle}`);

      console.log("details:", {
        application: context.application,
        identifier,
        controller: context,
        element: context.element
      });

      console.groupEnd();
    }
  });

  ["initialize", "connect", "disconnect"].forEach(lifecycle => {
    callbacks[lifecycle].push(function() {
      debugCallback({ for: lifecycle }).log(this);
    });
  });
}
Here, too, I'd like to highlight the readability: “debug callback for lifecycle”. Nice, right?
The values and targets logic has a bit more to it, let's look at src/enableDebug/values.js:
export function values(identifier, callbacks) {
  callbacks.connect.push(function() {
    logValues({ on: this.element, for: identifier });
  });
}

function logValues({ on: element, for: identifier }) {
  const values = allValues(element, identifier);

  if (Object.keys(values).length === 0) return;

  console.group("Values");
  console.table(values);
  console.groupEnd();
}

function allValues(element, identifier) {
  const prefix = `${identifier}-`;
  const dataPrefix = "data-";
  const valueSuffix = "-value";

  // logic to get values from the element/identifier
}
It pushes the result from logValues, which is just the grouped console.table result onto the connect array that is defined in src/debuggable.js (same is happening for the targets):
export function debuggable(application, { with: features }) {
  // …
  const callbacks = {
    initialize: [],
    connect: [],
    disconnect: []
  };
  // …
}
Still in src/debuggable.js these functions are then invoked within the controller's connect (and other lifecycle methods):
export function debuggable(application, { with: features }) {
  // …

  controller.prototype.connect = function() {
    callbacks.connect.forEach(hook => hook.call(this));

    // …
  };
}
And that's all there is to it. I hope this short tour will help if you are interested in exploring this feature more. Maybe with enough weight and interest behind it, it can even be ported into Stimulus it self.