If You Can’t Observe It
This is episode 4 of A Hands-On Guide to Modern Software Development series. Modern applications are like living systems — always running, always changing. And if you can't see what’s happening inside them, you're flying blind. In this episode, we’ll integrate OpenTelemetry with our ASP.NET minimal API and trace everything from database calls to cache hits — all visualized in Jaeger. We’ll also learn how to spot inefficiencies, validate cache behavior, and instrument our code for insights. Why Observability? Here’s why: Traces help you understand how requests flow across services (and through layers like DB, cache, etc.). Metrics provide high-level health signals like request rates and error counts. Logs give you contextual breadcrumbs when something breaks. In this episode, we’ll focus on distributed tracing using OpenTelemetry + Jaeger. Why OpenTelemetry Standardized: One format for traces, metrics, and logs. Vendor-neutral: Export to Jaeger, Prometheus, and others. Well-supported: Actively developed, .NET-friendly. Instrument once: Works across libraries and runtimes. Our Goal We want to evolve our architecture from this: To this: The key additions: OpenTelemetry SDK: Adds instrumentation to our app. OpenTelemetry Collector: Gathers telemetry and forwards it to backends. Jaeger: Visualizes trace data in a web UI. Step-by-Step Setup Let’s break this down: 1. Configure OpenTelemetry Collector Create src/telemetry/otel-collector.yml: receivers: otlp: protocols: grpc: endpoint: otel-collector:4317 http: endpoint: otel-collector:4318 exporters: otlp: endpoint: "jaeger:4317" tls: insecure: true processors: batch: service: pipelines: traces: receivers: [otlp] processors: [batch] exporters: [otlp] This sets up an OTLP pipeline to receive traces and forward them to Jaeger: otel-collector: Container name used for internal Docker networking. jaeger: Same — used as hostname inside the Docker network. tls.insecure: true: Disables TLS checks (safe for local development). 2. Update docker-compose.yml Add two new services: jaeger: image: jaegertracing/jaeger:2.5.0 container_name: jaeger ports: - "16686:16686" # Jaeger UI otel-collector: image: ghcr.io/open-telemetry/opentelemetry-collector-releases/opentelemetry-collector-contrib:0.125.0 container_name: otel_collector command: ["--config=/etc/otel-collector.yml"] volumes: - ./src/telemetry/otel-collector.yml:/etc/otel-collector.yml ports: - "4317:4317" depends_on: jaeger: condition: service_started Then run: docker-compose up -d Explanations: otel-collector: Reads config from the mounted file and listens on port 4317 for OTLP traces from the web API. jaeger: Exposes port 16686 so you can access the Jaeger UI at localhost. Instrument the API with OpenTelemetry These packages need to be added to the BooksInventory.WebApi project: dotnet add package OpenTelemetry.Extensions.Hosting --version 1.12.0 dotnet add package OpenTelemetry.Instrumentation.AspNetCore --version 1.12.0 dotnet add package Npgsql.OpenTelemetry --version 9.0.3 dotnet add package OpenTelemetry.Instrumentation.Console --version 1.12.0 dotnet add package OpenTelemetry.Instrumentation.OpenTelemetryProtocol --version 1.12.0 Now modify Program.cs: // after service registrations var service = ResourceBuilder .CreateDefault() .AddService("BooksInventory.WebApi") .AddAttributes( [ new("service.name", "BooksInventory.WebApi"), new("service.namespace", "BooksInventory.WebApi"), ]); builder.Services.AddOpenTelemetry() .WithTracing(tracing => tracing .SetResourceBuilder(service) .AddAspNetCoreInstrumentation() .AddNpgsql() .AddOtlpExporter() .AddConsoleExporter()); // before this code var app = builder.Build(); Let’s break it down: Resource Definition: "BooksInventory.WebApi" provides trace context, identifying spans in Jaeger. HTTP Tracing: AddAspNetCoreInstrumentation() tracks requests, latency, and status codes. Database Tracing: AddNpgsql() captures PostgreSQL queries and connection details. Trace Export: AddOtlpExporter() sends traces via OTLP protocol to the collector. Local Debugging: AddConsoleExporter() logs traces to the console for quick validation. Now make sure you initialize the database and start the web API: dotnet ef database update --project src/BooksInventory.WebApi/BooksInventory.WebApi.csproj dotnet run --project src/BooksInventory.WebApi/BooksInventory.WebApi.csproj ✅ Tip: Execute some requests to see traces printed in the console. This helps you verify instrumentation before wiring up Jaeger. # ------------------------------------ # Span from PostgreSQL instrumentation # ------------------------------------ Ac
This is episode 4 of A Hands-On Guide to Modern Software Development series.
Modern applications are like living systems — always running, always changing. And if you can't see what’s happening inside them, you're flying blind.
In this episode, we’ll integrate OpenTelemetry with our ASP.NET minimal API and trace everything from database calls to cache hits — all visualized in Jaeger. We’ll also learn how to spot inefficiencies, validate cache behavior, and instrument our code for insights.
Why Observability?
Here’s why:
- Traces help you understand how requests flow across services (and through layers like DB, cache, etc.).
- Metrics provide high-level health signals like request rates and error counts.
- Logs give you contextual breadcrumbs when something breaks.
In this episode, we’ll focus on distributed tracing using OpenTelemetry + Jaeger.
Why OpenTelemetry
- Standardized: One format for traces, metrics, and logs.
- Vendor-neutral: Export to Jaeger, Prometheus, and others.
- Well-supported: Actively developed, .NET-friendly.
- Instrument once: Works across libraries and runtimes.
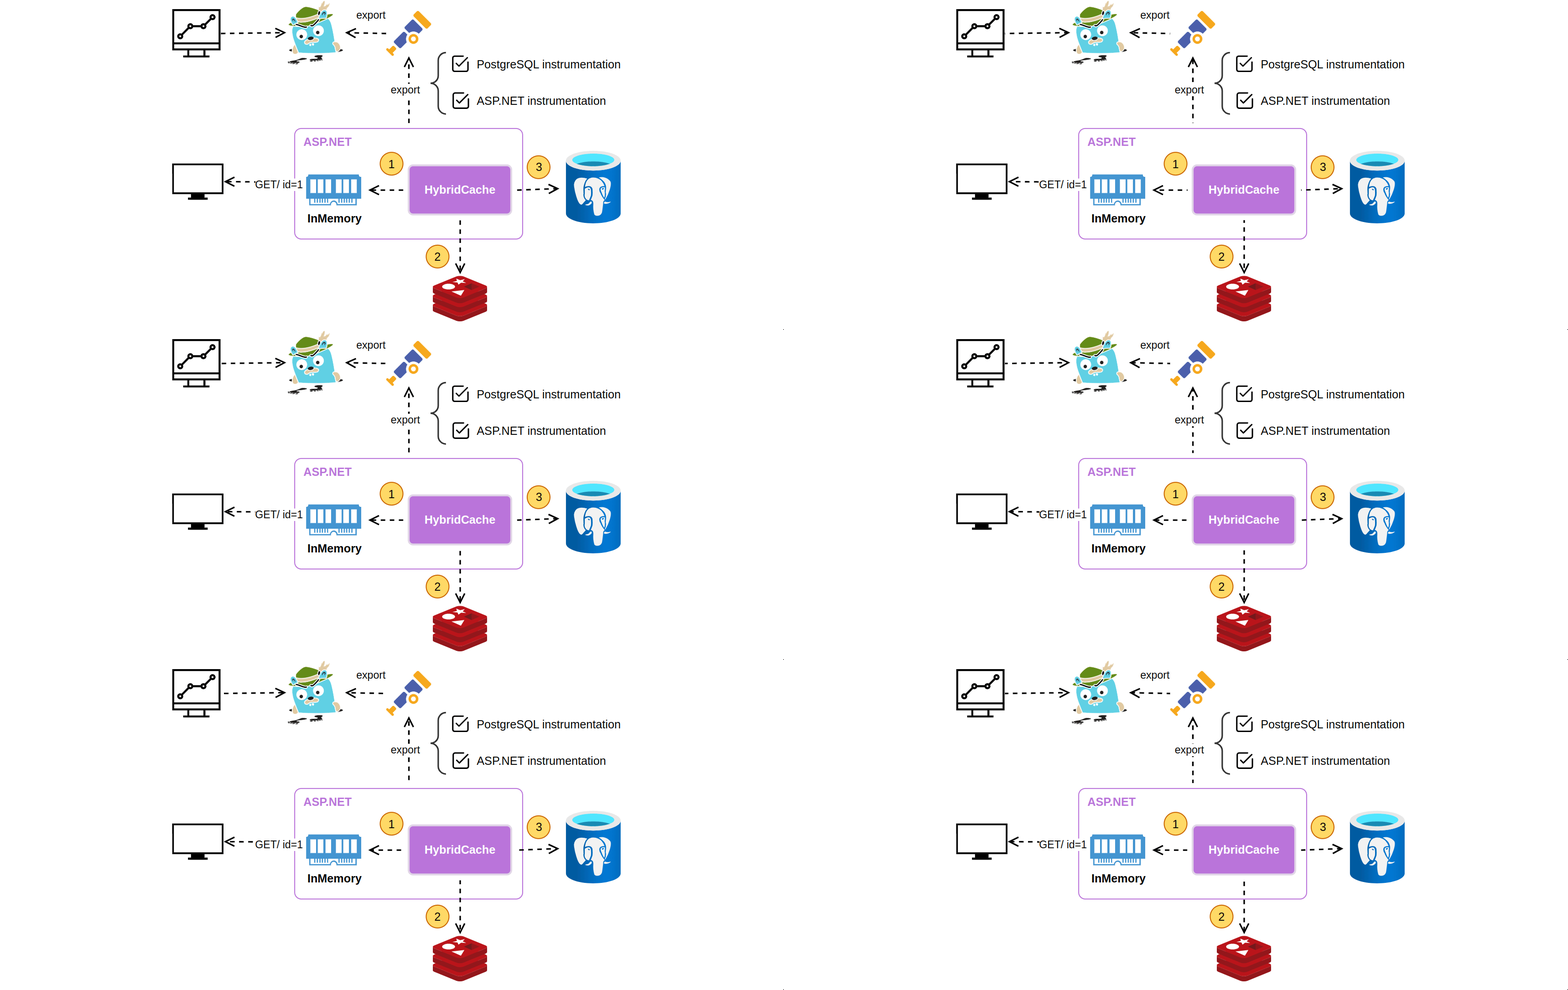
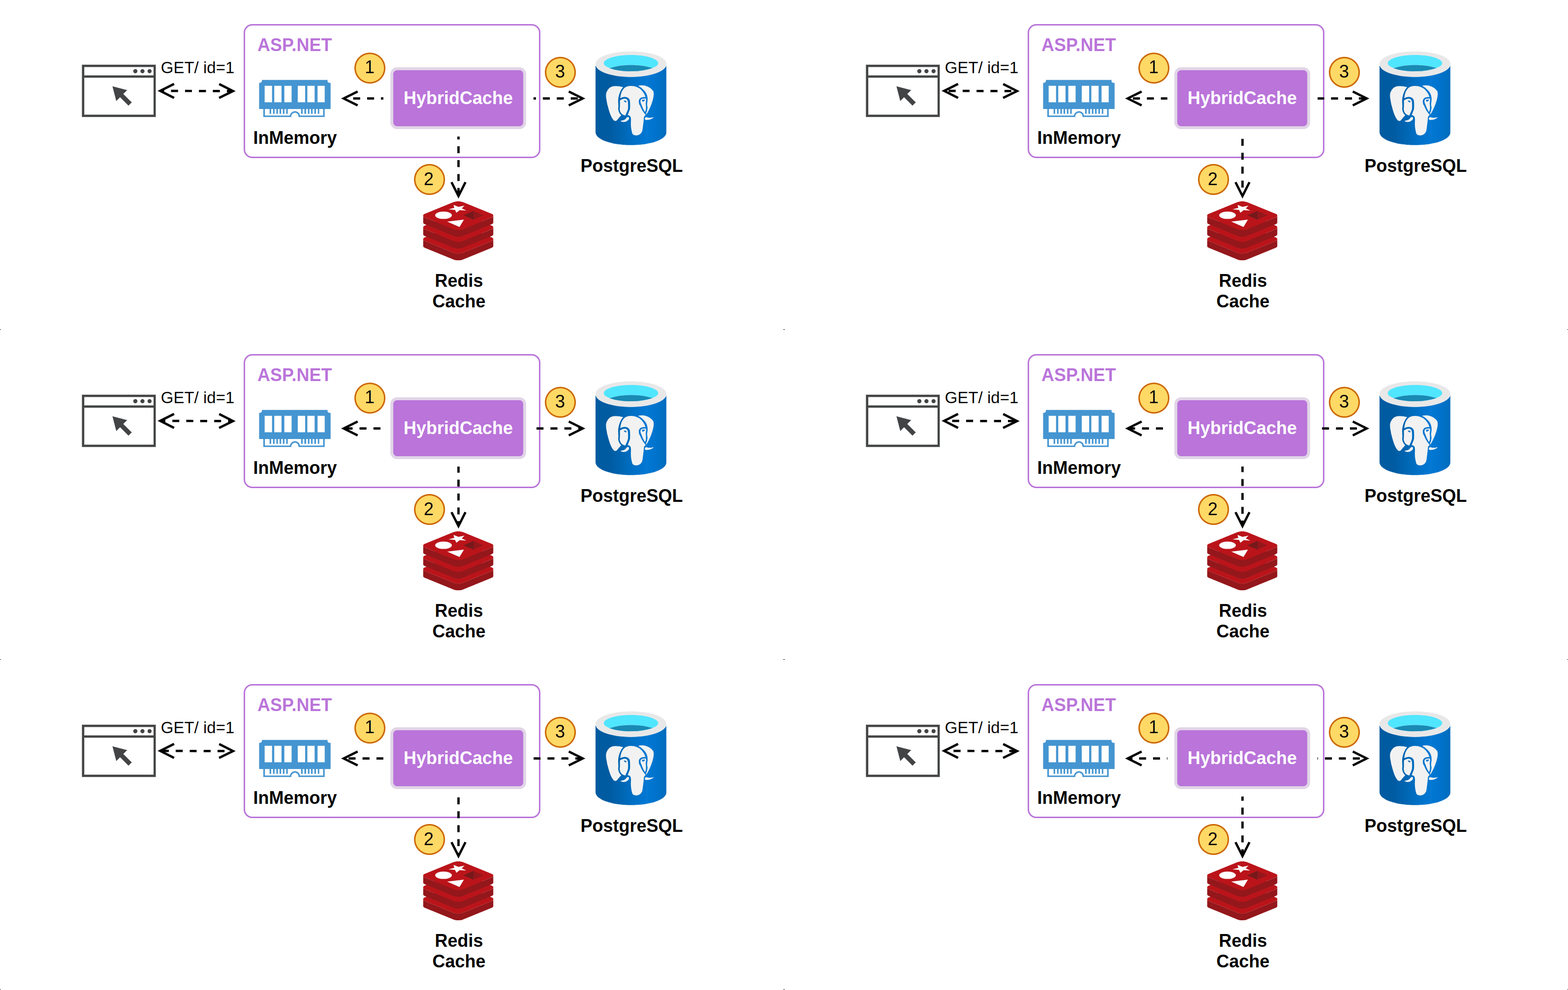
Our Goal
We want to evolve our architecture from this:
To this:
The key additions:
- OpenTelemetry SDK: Adds instrumentation to our app.
- OpenTelemetry Collector: Gathers telemetry and forwards it to backends.
- Jaeger: Visualizes trace data in a web UI.
Step-by-Step Setup
Let’s break this down:
1. Configure OpenTelemetry Collector
Create src/telemetry/otel-collector.yml:
receivers:
  otlp:
    protocols:
      grpc:
        endpoint: otel-collector:4317
      http:
        endpoint: otel-collector:4318

exporters:
  otlp:
    endpoint: "jaeger:4317"
    tls:
      insecure: true

processors:
  batch:

service:
  pipelines:
    traces:
      receivers: [otlp]
      processors: [batch]
      exporters: [otlp]
This sets up an OTLP pipeline to receive traces and forward them to Jaeger:
-
otel-collector: Container name used for internal Docker networking. -
jaeger: Same — used as hostname inside the Docker network. -
tls.insecure: true: Disables TLS checks (safe for local development).
2. Update docker-compose.yml
Add two new services:
jaeger:
  image: jaegertracing/jaeger:2.5.0
  container_name: jaeger
  ports:
    - "16686:16686" # Jaeger UI

otel-collector:
  image: ghcr.io/open-telemetry/opentelemetry-collector-releases/opentelemetry-collector-contrib:0.125.0
  container_name: otel_collector
  command: ["--config=/etc/otel-collector.yml"]
  volumes:
    - ./src/telemetry/otel-collector.yml:/etc/otel-collector.yml
  ports:
    - "4317:4317"
  depends_on:
    jaeger:
      condition: service_started
Then run:
docker-compose up -d
Explanations:
-
otel-collector: Reads config from the mounted file and listens on port4317for OTLP traces from the web API. -
jaeger: Exposes port16686so you can access the Jaeger UI atlocalhost.
Instrument the API with OpenTelemetry
These packages need to be added to the BooksInventory.WebApi project:
dotnet add package OpenTelemetry.Extensions.Hosting --version 1.12.0
dotnet add package OpenTelemetry.Instrumentation.AspNetCore --version 1.12.0
dotnet add package Npgsql.OpenTelemetry --version 9.0.3

dotnet add package OpenTelemetry.Instrumentation.Console --version 1.12.0
dotnet add package OpenTelemetry.Instrumentation.OpenTelemetryProtocol --version 1.12.0
Now modify Program.cs:
// after service registrations

var service = ResourceBuilder
    .CreateDefault()
    .AddService("BooksInventory.WebApi")
    .AddAttributes(
    [
        new("service.name", "BooksInventory.WebApi"),
        new("service.namespace", "BooksInventory.WebApi"),
    ]);

builder.Services.AddOpenTelemetry()
    .WithTracing(tracing => tracing
        .SetResourceBuilder(service)
        .AddAspNetCoreInstrumentation()
        .AddNpgsql()
        .AddOtlpExporter()
        .AddConsoleExporter());

// before this code
var app = builder.Build();
Let’s break it down:
-
Resource Definition:
"BooksInventory.WebApi"provides trace context, identifying spans in Jaeger. -
HTTP Tracing:
AddAspNetCoreInstrumentation()tracks requests, latency, and status codes. -
Database Tracing:
AddNpgsql()captures PostgreSQL queries and connection details. -
Trace Export:
AddOtlpExporter()sends traces via OTLP protocol to the collector. -
Local Debugging:
AddConsoleExporter()logs traces to the console for quick validation.
Now make sure you initialize the database and start the web API:
dotnet ef database update --project src/BooksInventory.WebApi/BooksInventory.WebApi.csproj
dotnet run --project src/BooksInventory.WebApi/BooksInventory.WebApi.csproj
✅ Tip: Execute some requests to see traces printed in the console. This helps you verify instrumentation before wiring up Jaeger.
# ------------------------------------
# Span from PostgreSQL instrumentation
# ------------------------------------
Activity.TraceId:            a867a3ea03726e71f6fe56b1e8a421d1
Activity.SpanId:             103bacdf7a8e1da0
Activity.Tags:
    db.statement: INSERT INTO "Books" ("Author", "ISBN", "Title")
VALUES (@p0, @p1, @p2)
RETURNING "Id";
    db.system: postgresql
    db.connection_string: Host=localhost;Port=5432;Database=books_inventory;Username=user
    db.user: user
    db.name: books_inventory

# ------------------------------------
# Span from AspNetCore instrumentation
# ------------------------------------
Activity.TraceId:            a867a3ea03726e71f6fe56b1e8a421d1
Activity.SpanId:             1e5c7b4469f16e70
Activity.Tags:
    server.address: localhost
    server.port: 5000
    http.request.method: POST
    url.scheme: http
    url.path: /addBook
This proves that tracing is working — we see both HTTP-level and database-level spans captured and logged.
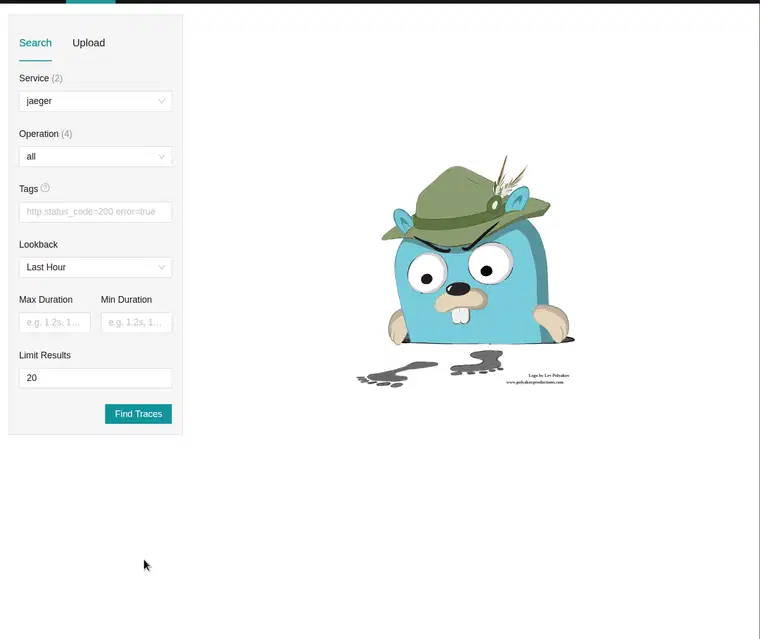
Visualize Traces in Jaeger
Visit http://localhost:16686 — you’ll land on the Jaeger UI. Once traces are generated, you can inspect them using Jaeger’s UI. Below is an example of how it looks in action:
Execute the following REST operations to validate cache behavior:
GET
/books/{id}(first request) → Cache miss, fetches from DB.

GET
/books/{id}(second request) → Cache hit, retrieves from Redis (no DB call).

This confirms caching is working — first retrieval queries the DB, while subsequent requests serve data directly from cache.
Debugging with Tracing: Real-World Benefits
⚠️ Found: Inefficient DELETE
Jaeger reveals that our DELETE endpoint was doing two DB round-trips:
Looking at the code for delete in Program.cs:
app.MapDelete("/books/{id}", async (int id, BooksInventoryDbContext db, HybridCache cache) =>
{
    // SELECT: 1st roundtrip to db.
    var book = await db.Books.FindAsync(id);
    if (book is null)
    {
        return Results.NotFound(new { Message = "Book not found", BookId = id });
    }

    // DELETE: 2nd roundtrip to db.
    db.Books.Remove(book);
    await db.SaveChangesAsync();

    // Remove the entry from the cache.
    await cache.RemoveAsync($"book_{id}");

    return Results.NoContent();
});


