


How to Test and Debug Servers with Postman MCP Client, A Step by Step guide.
In the contemporary landscape of software engineering, particularly with the ascendance of microservices architecture and intricate API integrations, the capacity for rigorous testing and effective debugging of server-side applications is of paramount importance. Application Programming Interfaces (APIs) serve as the critical communicative conduits between disparate software components. Ensuring their correct, reliable, and efficient operation is non-negotiable for system integrity and performance. Postman has distinguished itself as an essential instrument for developers and quality assurance professionals engaging with APIs. It offers a sophisticated, yet intuitively designed, platform for dispatching HTTP requests, meticulously inspecting server responses, automating test suites, and systematically debugging server-side behavior. This document provides an in-depth, professional guide to leveraging the Postman client for the comprehensive testing and debugging of server applications. While Postman has long been a cornerstone for API testing and development, the landscape of API tools is continuously evolving. For teams and individuals evaluating their tooling options or seeking functionalities that may better align with specific workflow preferences, Apidog presents itself as a noteworthy alternative worth consideration. apidog.com Apidog is an integrated collaboration platform designed to cover the entire API lifecycle, encompassing design, development, testing, documentation, and mocking. Users exploring alternatives might find Apidog compelling for several reasons: Unified Platform Approach: Apidog aims to consolidate multiple API-related tasks into a single environment. This can streamline workflows by reducing the need to switch between different tools for design (e.g., OpenAPI/Swagger), documentation, mocking, debugging, and automated testing. The tight integration between these phases can lead to improved efficiency and consistency. Collaboration-Centric Features: For teams, Apidog often emphasizes real-time collaboration, allowing multiple users to work concurrently on API design, testing, and documentation, which can enhance productivity and ensure all team members are aligned. Design-First Capabilities: If your workflow prioritizes an API design-first approach, Apidog provides robust features for creating and managing API specifications (such as OpenAPI). This can help in establishing clear contracts and generating documentation, mocks, and tests directly from the design. Integrated Mocking and Testing: The platform typically offers sophisticated mocking capabilities that are closely linked with the API design and testing modules, allowing for early and reliable testing of dependent services. Automated Testing and CI/CD Integration: Similar to Postman, Apidog generally supports comprehensive automated testing features and integrations with CI/CD pipelines to facilitate continuous testing and delivery. Ultimately, the choice of an API tool depends on the specific needs, existing workflows, and collaborative practices of a team or individual. While Postman offers a mature and feature-rich environment, exploring Apidog could reveal a platform whose integrated nature, specific feature set, or user experience paradigm offers a more tailored fit for your API development and testing endeavors. Evaluating Apidog by trialing its features on a pilot project can be an effective way to determine its suitability for your requirements. I. Initializing the Postman Environment A foundational step involves the proper setup and familiarization with the Postman client. Initial Setup and Installation The Postman application can be acquired from its official website and installed on common operating systems, including Windows, macOS, and Linux. The installation procedure is generally direct and uncomplicated. Navigating the Postman Interface Upon launching Postman, a clear understanding of its primary interface elements is beneficial: Workspace: This serves as the principal organizational area for all API development and testing activities. Users can maintain individual or collaborative team workspaces. Sidebar (Left Pane): This area houses crucial organizational entities such as Collections (groups of requests), APIs (for API design and documentation), Environments (sets of variables), Mock Servers, Monitors (for scheduled runs), and History (chronicle of past requests). The focus of this guide will be predominantly on Collections and Environments. Request Builder (Central/Upper Pane): This is the interactive zone for constructing HTTP requests, encompassing the selection of HTTP methods, input of URLs, and definition of headers, request bodies, authorization parameters, and more. Response Viewer (Central/Lower Pane): Post-request, this section displays the server's response, segmented into the response body, headers, cookies, test execution results, status code, resp
In the contemporary landscape of software engineering, particularly with the ascendance of microservices architecture and intricate API integrations, the capacity for rigorous testing and effective debugging of server-side applications is of paramount importance. Application Programming Interfaces (APIs) serve as the critical communicative conduits between disparate software components. Ensuring their correct, reliable, and efficient operation is non-negotiable for system integrity and performance. Postman has distinguished itself as an essential instrument for developers and quality assurance professionals engaging with APIs. It offers a sophisticated, yet intuitively designed, platform for dispatching HTTP requests, meticulously inspecting server responses, automating test suites, and systematically debugging server-side behavior.
This document provides an in-depth, professional guide to leveraging the Postman client for the comprehensive testing and debugging of server applications.
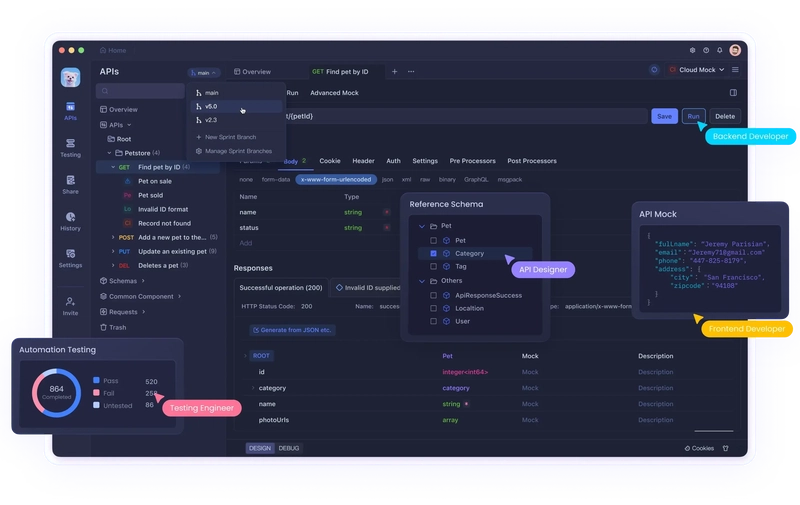
While Postman has long been a cornerstone for API testing and development, the landscape of API tools is continuously evolving. For teams and individuals evaluating their tooling options or seeking functionalities that may better align with specific workflow preferences, Apidog presents itself as a noteworthy alternative worth consideration.
Apidog is an integrated collaboration platform designed to cover the entire API lifecycle, encompassing design, development, testing, documentation, and mocking. Users exploring alternatives might find Apidog compelling for several reasons:
- Unified Platform Approach: Apidog aims to consolidate multiple API-related tasks into a single environment. This can streamline workflows by reducing the need to switch between different tools for design (e.g., OpenAPI/Swagger), documentation, mocking, debugging, and automated testing. The tight integration between these phases can lead to improved efficiency and consistency.
- Collaboration-Centric Features: For teams, Apidog often emphasizes real-time collaboration, allowing multiple users to work concurrently on API design, testing, and documentation, which can enhance productivity and ensure all team members are aligned.
- Design-First Capabilities: If your workflow prioritizes an API design-first approach, Apidog provides robust features for creating and managing API specifications (such as OpenAPI). This can help in establishing clear contracts and generating documentation, mocks, and tests directly from the design.
- Integrated Mocking and Testing: The platform typically offers sophisticated mocking capabilities that are closely linked with the API design and testing modules, allowing for early and reliable testing of dependent services.
- Automated Testing and CI/CD Integration: Similar to Postman, Apidog generally supports comprehensive automated testing features and integrations with CI/CD pipelines to facilitate continuous testing and delivery.
Ultimately, the choice of an API tool depends on the specific needs, existing workflows, and collaborative practices of a team or individual. While Postman offers a mature and feature-rich environment, exploring Apidog could reveal a platform whose integrated nature, specific feature set, or user experience paradigm offers a more tailored fit for your API development and testing endeavors. Evaluating Apidog by trialing its features on a pilot project can be an effective way to determine its suitability for your requirements.
I. Initializing the Postman Environment
A foundational step involves the proper setup and familiarization with the Postman client.
Initial Setup and Installation
The Postman application can be acquired from its official website and installed on common operating systems, including Windows, macOS, and Linux. The installation procedure is generally direct and uncomplicated.
Navigating the Postman Interface
Upon launching Postman, a clear understanding of its primary interface elements is beneficial:
- Workspace: This serves as the principal organizational area for all API development and testing activities. Users can maintain individual or collaborative team workspaces.
- Sidebar (Left Pane): This area houses crucial organizational entities such as Collections (groups of requests), APIs (for API design and documentation), Environments (sets of variables), Mock Servers, Monitors (for scheduled runs), and History (chronicle of past requests). The focus of this guide will be predominantly on Collections and Environments.
- Request Builder (Central/Upper Pane): This is the interactive zone for constructing HTTP requests, encompassing the selection of HTTP methods, input of URLs, and definition of headers, request bodies, authorization parameters, and more.
- Response Viewer (Central/Lower Pane): Post-request, this section displays the server's response, segmented into the response body, headers, cookies, test execution results, status code, response time, and data size.
- Environment Selector (Upper Right): This dropdown permits the selection of an active environment, facilitating dynamic variable substitution within requests.
- Console (Lower Bar): An indispensable utility for in-depth debugging, the console reveals raw request and response data, alongside any custom log messages generated from scripts.
II. Executing an Initial Request: Fundamental Operations
The core utility of Postman lies in its ability to dispatch HTTP requests to server endpoints and meticulously analyze the ensuing responses.
To initiate a request, one typically begins by opening a new request tab, achievable by selecting the '+' icon or by adding a request within an existing Collection. Subsequently, the appropriate HTTP method is selected from a dropdown list, which defaults to GET. Standard methods include GET for data retrieval, POST for data submission (often leading to resource creation), PUT for complete resource replacement, PATCH for partial resource modification, and DELETE for resource removal. Less frequently used methods like OPTIONS and HEAD are also available.
The request URL, representing the full address of the target API endpoint (e.g., http://localhost:3000/api/users or https://api.example.com/v1/products), is then entered into the address bar adjacent to the method selector. Finally, the request is dispatched by activating the "Send" command.
Upon transmission, the server's response is displayed in the Response Viewer, warranting careful examination of:
-
Status Code: This numerical code (e.g.,
200 OK,404 Not Found,500 Internal Server Error) provides an immediate indication of the request's outcome. - Response Body: This contains the data payload returned by the server. Postman endeavors to format this data for readability (Pretty view). Alternative views include Raw text, Preview (for HTML rendering), and Visualize (for custom data representations using templates).
-
Headers: These are the HTTP headers returned by the server, such as
Content-Type,Date,Server, and any custom-defined headers. - Cookies: Any cookies established by the server during the transaction are listed here.
- Time & Size: These metrics offer insights into the performance characteristics of the request-response cycle.
III. Constructing Advanced and Parameterized Requests
Servers frequently necessitate more intricate request structures beyond a simple URL and method.
Query Parameters for GET Requests
For GET requests that require parameters—for instance, to implement filtering, sorting, or pagination—the "Params" tab, located beneath the URL bar, is utilized. Key-value pairs are entered here (e.g., Key: status, Value: active), and Postman automatically appends them to the URL with appropriate encoding (e.g., ?status=active). Alternatively, these parameters can be typed directly into the URL.
Request Body for POST, PUT, PATCH Operations
These HTTP methods commonly involve the transmission of data to the server. The "Body" tab facilitates this:
-
form-data: Employed for submitting forms that may include files or multifaceted data structures. It supports key-value pairs where values can be textual or file-based, simulating multipart form submissions. -
x-www-form-urlencoded: Represents the standard encoding for simple HTML form submissions, transmitting data as URL-encoded key-value pairs within the request body. -
raw: This is the predominant choice for contemporary APIs. It permits the dispatch of arbitrary data, provided aContent-Typeis specified. The data format (e.g.,JSON,XML,Text,HTML) is selected from a dropdown. It is imperative that theContent-Typeheader, configured in the "Headers" tab, aligns with this selection (e.g.,application/jsonfor JSON payloads). The payload is directly entered or pasted into the provided text area. An illustrative JSON body:
{ "name": "Advanced Component", "version": "1.1", "status": "pending_review" } binary: Facilitates the upload of a single binary file as the direct content of the request body.GraphQL: Offers a specialized interface for the construction of GraphQL queries, mutations, and associated variables.
Request Headers
The "Headers" tab is used to append or override HTTP request headers. While Postman automatically includes common headers (e.g., User-Agent, Accept), custom headers mandated by the API (e.g., X-API-Key, Accept-Language) can be added here. For raw body types, ensuring the Content-Type header is accurately set is critical, although Postman often infers and sets this based on the raw type selection.
Authorization Mechanisms
Many APIs enforce authentication. The "Authorization" tab provides a structured way to configure this:
One selects the requisite authentication type (e.g., No Auth, API Key, Bearer Token, Basic Auth, OAuth 1.0, OAuth 2.0). The necessary credentials (such as tokens, username/password combinations, or key-value pairs) are then supplied. Postman automatically constructs the appropriate Authorization headers or appends parameters based on the chosen authentication scheme.
IV. Enhancing Efficiency and Debugging with Environments and Variables
The practice of hardcoding values like base URLs, API keys, or specific identifiers directly within requests is suboptimal for maintainability and testing across diverse deployment stages (e.g., development, staging, production).
Establishing Environments for Dynamic Testing
To create an environment, one navigates to the "Environments" tab in the left sidebar and initiates the creation of a new environment. A descriptive name (e.g., "Development Server", "Production API") is assigned. Variables are then defined as key-value pairs, distinguishing between an "Initial Value" (often synced when sharing) and a "Current Value" (used locally during execution, safeguarding sensitive data from inadvertent sharing).
Exemplary variables might include:
-
baseURL:https://api.staging.example.com/v2 -
sessionToken:a_dynamic_session_token_value -
resourceId:data_entry_005
The desired environment is activated using the selector in the top-right corner of the Postman interface.
Utilizing Variables in Request Construction
Hardcoded values within requests (URLs, parameters, headers, body content, authorization fields) should be replaced with variable placeholders using the {{variableName}} syntax.
For instance, a URL might become {{baseURL}}/items/{{resourceId}}, or a header might be defined as Key: Authorization, Value: Bearer {{sessionToken}}.
Understanding Variable Scopes
Postman employs a hierarchical variable scoping mechanism: Global > Environment > Collection > Local. Variables defined in a more specific scope take precedence over those in a broader scope, allowing for global defaults to be overridden at the environment or collection level.
Employing Variables in Debugging
When requests yield unexpected results, inspecting the resolved values of variables is a key debugging step. This can be done by hovering over the variable name in the request builder, by using the "eye" icon (Environment Quick Look) next to the environment selector, or by examining the Postman Console for the exact request details, including all resolved variable values.
V. Implementing Tests for Automated Validation and Enhanced Debugging
Postman's "Tests" tab facilitates the creation of JavaScript code snippets that execute subsequent to the reception of a server response. This capability is profoundly valuable for automated validation and for precisely identifying the locus of issues.
Accessing the Test Scripting Interface
The "Tests" tab is located within the Request Builder section.
Fundamental Test Syntax
Tests are structured using the pm.test() function, which accepts a descriptive name for the test and a callback function containing the assertion logic:
pm.test("A clear and descriptive test objective", function() { /* Assertion logic is placed here */ });
Common Assertion Patterns
Postman incorporates the ChaiJS BDD (Behavior-Driven Development) assertion library, enabling expressive tests:
-
Verifying Status Codes:
pm.test("Response status code is 201 (Created)", function () { pm.response.to.have.status(201); }); pm.test("Response indicates a client error (4xx range)", function () { // For expected error conditions pm.expect(pm.response.code).to.be.within(400, 499); }); -
Inspecting Response Body Content (assuming JSON):
const jsonData = pm.response.json(); // Parse JSON response pm.test("Response payload is a valid JSON object", function () { pm.expect(jsonData).to.be.an('object'); }); pm.test("Response contains the essential 'data' property", function () { pm.expect(jsonData).to.have.property('data'); }); pm.test("The 'id' in the response matches the expected identifier", function () { const expectedIdentifier = pm.environment.get("resourceId"); // Assuming 'resourceId' is an environment variable pm.expect(jsonData.data.id).to.eql(expectedIdentifier); }); pm.test("Description field includes a specific keyword", function () { pm.expect(jsonData.data.description).to.include("critical_update"); }); pm.test("An array of results is present and not empty", function () { pm.expect(jsonData.results_array).to.be.an('array').and.to.not.be.empty; }); -
Validating Response Headers:
pm.test("Content-Type header is present and specifies application/json", function () { pm.response.to.have.header("Content-Type"); pm.expect(pm.response.headers.get('Content-Type')).to.include('application/json'); }); -
Assessing Response Time:
pm.test("API response time is within acceptable limits (e.g., under 800ms)", function () {
    pm.expect(pm.response.responseTime).to.be.below(800);
});
Leveraging Tests for Effective Debugging
A failed test, clearly indicated in the "Test Results" tab of the response viewer, signifies that the server's response diverged from established expectations. This immediately narrows the diagnostic focus. Is the status code incorrect? Is a critical data field absent or malformed? Test failures provide direct pointers for debugging efforts, transforming them from speculative exploration into targeted investigation.
VI. Core Debugging Methodologies within Postman
When server interactions do not proceed as anticipated, Postman furnishes a suite of tools to aid in diagnosing the underlying cause.
Key debugging facilities include:
-
The Postman Console: Accessible via the Console icon in the application's bottom bar, this is arguably the most potent debugging instrument. It meticulously logs the complete raw request dispatched by Postman (inclusive of all resolved variables, headers, and the request body), enabling verification of precisely what was transmitted to the server. It also logs the full raw response received. Furthermore,
console.log()statements can be embedded within "Pre-request Script" or "Tests" sections to output variable values or custom messages at specific junctures of the request lifecycle (e.g., in Tests:console.log("Processing response data:", pm.response.json());). -
Comprehensive Response Analysis: A thorough examination of the response viewer is crucial. The Status Code provides the initial diagnostic clue. A
400 Bad Requestoften points to issues with the request's syntax or data payload. A401 Unauthorizedsuggests authentication failures. A404 Not Foundimplies an incorrect endpoint URL or non-existent resource.5xx Server Errorssignal problems originating on the server itself. The Response Body, especially in error scenarios, frequently contains descriptive error messages (ideally in a structured format like JSON), with fields such aserror,message, ordetails. The "Pretty" formatting option enhances readability. An unexpectedly empty or malformed body is a significant indicator. Headers such asContent-Type(and its consistency with the body format),Content-Length, and any custom diagnostic headers from the server should be scrutinized. -
Diligent Variable Inspection: The hover-over feature in the request builder or the Environment Quick Look facility (the "eye" icon) should be used to confirm that variables are resolving to their intended values prior to request dispatch. Issues stemming from an incorrect
baseURLor an invalidapiKeyare common pitfalls. - Systematic Iterative Testing: Debugging is frequently an iterative process of elimination. By modifying a single aspect of the request—such as altering a parameter, adjusting the request body, changing a header, or trying different authentication credentials—and resending, one can observe how the response changes. This methodical approach helps to isolate the root cause of the problem.
-
Strategic Use of Pre-request Scripts: Analogous to the "Tests" tab, the "Pre-request Script" tab allows for the execution of JavaScript code before the request is transmitted. This is beneficial for complex preparatory tasks, such as generating dynamic data (e.g., timestamps, unique identifiers), fetching temporary authorization tokens, or logging contextual information before the main request is initiated. Variables can be dynamically created or modified using
pm.variables.set()orpm.environment.set()(e.g.,pm.variables.set("requestTimestamp", new Date().toISOString());). - Selective Disabling of Parameters/Headers: Checkboxes adjacent to keys in the "Params" and "Headers" tabs permit the rapid disabling of specific items without permanent deletion. This is particularly useful for testing whether a specific parameter or header is the source of an issue.
VII. Structuring for Clarity and Maintainability: The Role of Collections
As the number of defined requests grows, maintaining organization becomes imperative for efficiency and clarity.
The Importance of Request Organization with Collections
Collections serve as containers for grouping related API requests. To create one, navigate to the "Collections" section in the left sidebar and initiate a new collection, assigning it a descriptive name (e.g., "User Profile Management API," "Inventory Service Test Suite").
Creating and Populating Collections
Once a request has been meticulously crafted and tested, it should be saved using the "Save" button. During the save process, the target collection is selected, and the request is given a meaningful name (e.g., "Retrieve User Details by ID," "Submit New Product Data").
Structuring with Folders
Within a collection, folders can be created to further categorize requests logically (e.g., "Authentication Endpoints," "User Resource Operations," "Order Fulfillment Process"). This hierarchical organization significantly improves navigability and understanding of complex API test suites.
Automated Execution with the Collection Runner
Collections are not merely organizational constructs; they are integral to automated testing via the "Collection Runner." This feature allows for the sequential execution of all requests within a collection or a specific folder. Options include specifying an active environment, defining the number of iterations for the run, and introducing delays between requests. Critically, the Collection Runner aggregates the results of all tests executed across the collection, providing a consolidated overview of the API's operational status. This is fundamental for implementing effective regression testing and continuous integration checks.
VIII. A Note on Mock Servers
While this guide primarily addresses the testing of live, operational servers, it is pertinent to mention Postman's capability to create Mock Servers. Within Postman, users can define example requests and their corresponding static responses. Postman then generates a unique URL that, when accessed, returns these predefined responses. This functionality is invaluable for frontend development teams who require a predictable API endpoint to develop against before the actual backend services are fully implemented, or for isolating client-side application behavior. This constitutes a simulation of a server, rather than a test of an existing one.
Conclusion
The Postman client represents an exceptionally versatile and powerful platform for interacting with, and verifying the intricate behavior of, server-side applications and APIs. Through the systematic construction of HTTP requests, the strategic use of environments and variables for dynamic testing, the meticulous analysis of server responses, and the development of targeted automated tests, development and quality assurance teams can dramatically streamline the process of identifying and resolving server-side defects. A proficient command of the techniques delineated in this professional guide—ranging from fundamental request dispatch to advanced debugging utilizing the Postman Console and sophisticated test scripting—empowers organizations to build more robust, reliable, and thoroughly documented APIs. The integration of consistent, methodical testing with Postman should be regarded as an indispensable component of any modern software development lifecycle that involves API interactions.