


_Alexey_Kotelnikov_Alamy.jpg?width=1280&auto=webp&quality=80&disable=upscale#)


Making WebStorm Faster: How We’re Improving Performance Behind the Scenes
At WebStorm, performance isn’t a side project – it’s a core part of what we do. Every millisecond counts when you’re deep in the flow, writing and navigating code. We’ve heard your feedback loud and clear: performance issues break that flow, and they’re frustrating. That’s why improving speed, responsiveness, and reliability is one of our […]

At WebStorm, performance isn’t a side project – it’s a core part of what we do. Every millisecond counts when you’re deep in the flow, writing and navigating code. We’ve heard your feedback loud and clear: performance issues break that flow, and they’re frustrating. That’s why improving speed, responsiveness, and reliability is one of our key focus areas.
In this post, we want to take you behind the scenes of how we’re working to make WebStorm faster – from testing setups to tooling, from tracking regressions to learning from real-world projects. Whether you’ve experienced lags in typing, slow code completion, or sluggish indexing, know that we’re on it. Here’s how.
Building a smarter, broader performance suite
Performance can mean different things depending on what you’re doing – typing in a JavaScript file, triggering completions in a TypeScript project, or running inspections in a Vue component. That’s why we’ve built a constantly evolving performance test suite that covers key IDE workflows, including:
- Typing latency
- Code completion responsiveness
- Inspection speed
- Indexing performance
Each of these areas is measured in isolation and under the same conditions. We test across multiple languages, frameworks, and library setups to understand how changes affect actual developer experiences.
A dashboard that keeps us honest
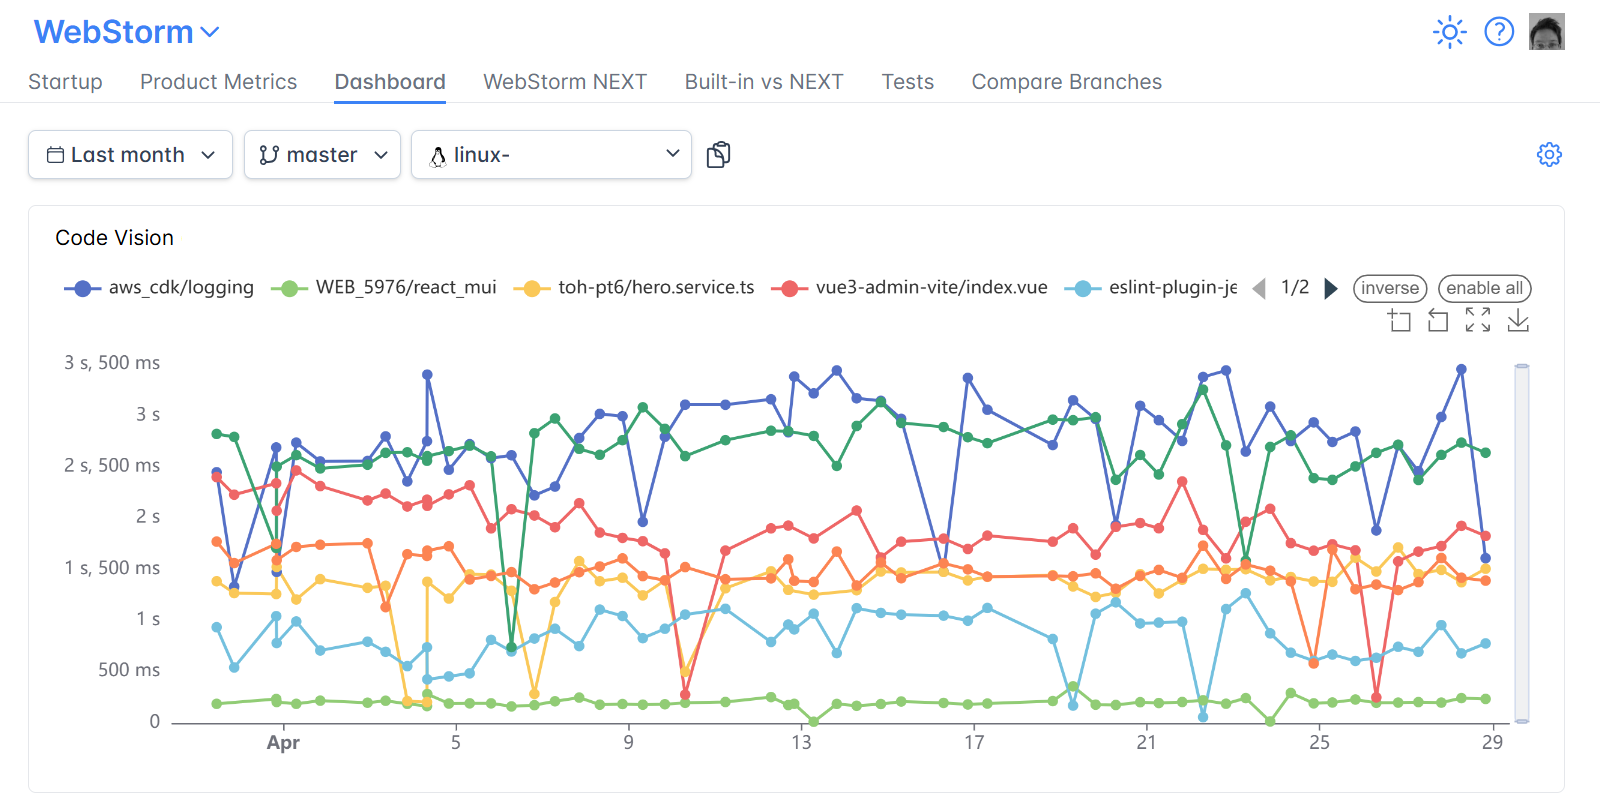
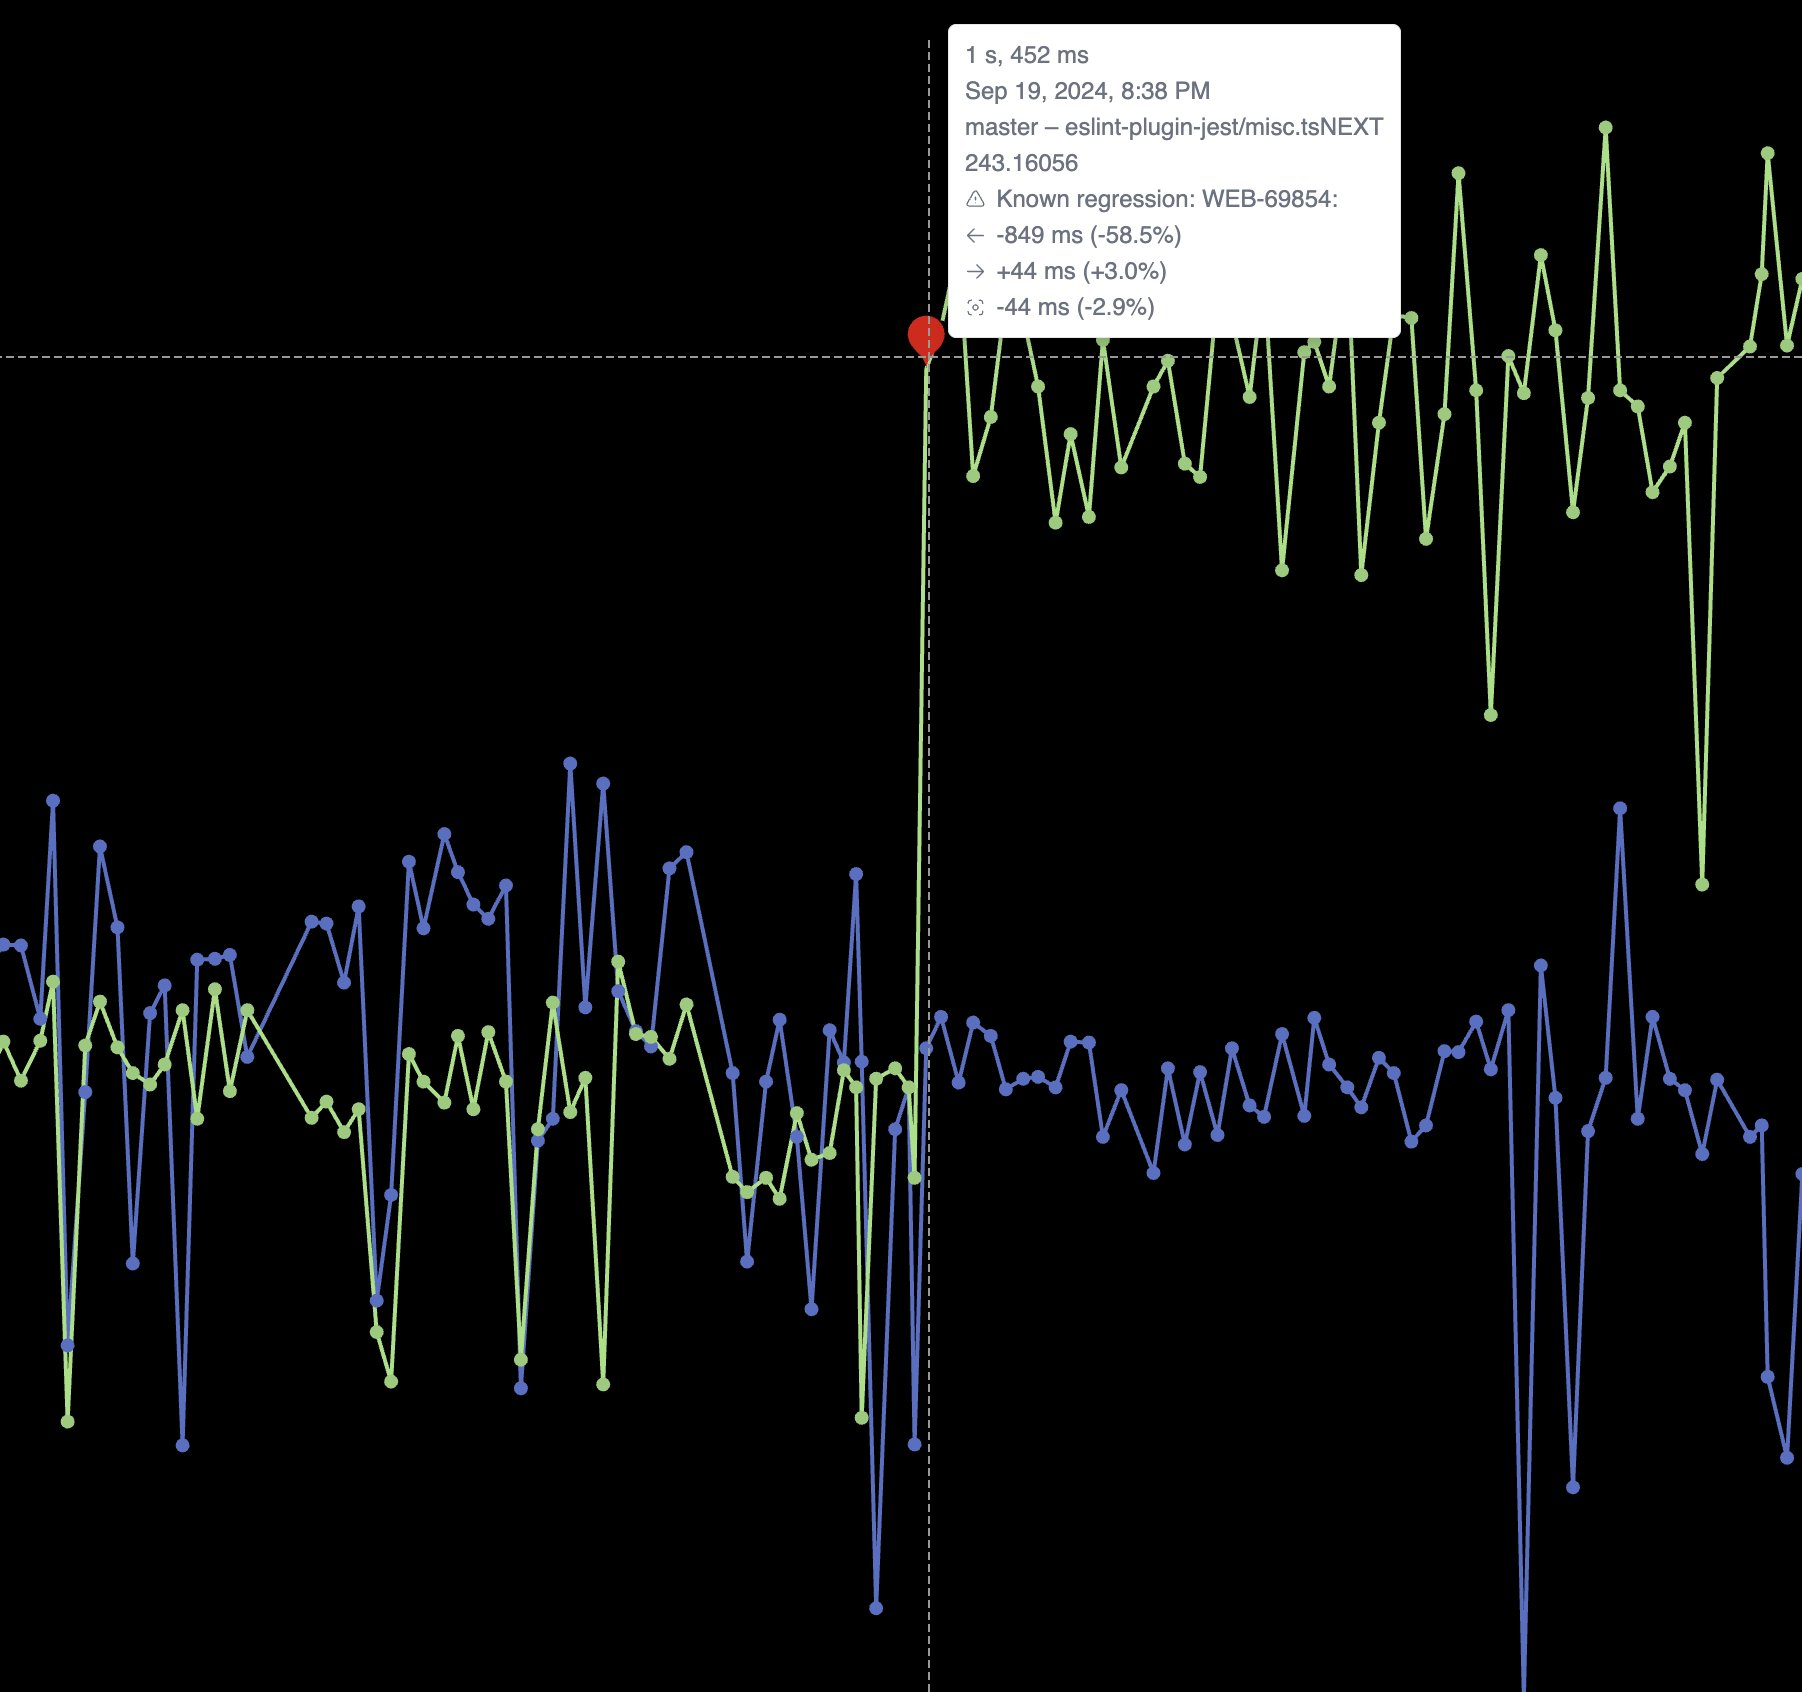
To track performance regressions and improvements across the IDE, we rely on our internal tool, the IJ-Perf monitoring tool. It displays the collected performance metrics twice daily, giving us a steady stream of information we can monitor.
When a change is made that might affect performance, like a modification to indexing or completion logic, IJ-Perf displays the new changed value on the IJ-Perf charts. But we don’t jump at the first sign of trouble. Performance can fluctuate for many reasons: CI noise, one-off slowdowns, or platform changes. That’s why we usually wait for multiple runs before investigating a suspected degradation. Once a slowdown proves consistent, we dig deeper.
IJ-Perf gives us a detailed view of various IDE behaviors – from typing latency to indexing times. Some aggregate metrics are shown by default, but there’s also a toggle to inspect more granular data, like first completion time, helping us pinpoint specific pain points.
We’ve also improved how performance regressions are handled. For instance, we simplified the process of creating a YouTrack issue for an incident (performance or optimization) from IJ-Perf. That means if a regression is detected, we can create a ticket with the full context without leaving the dashboard.
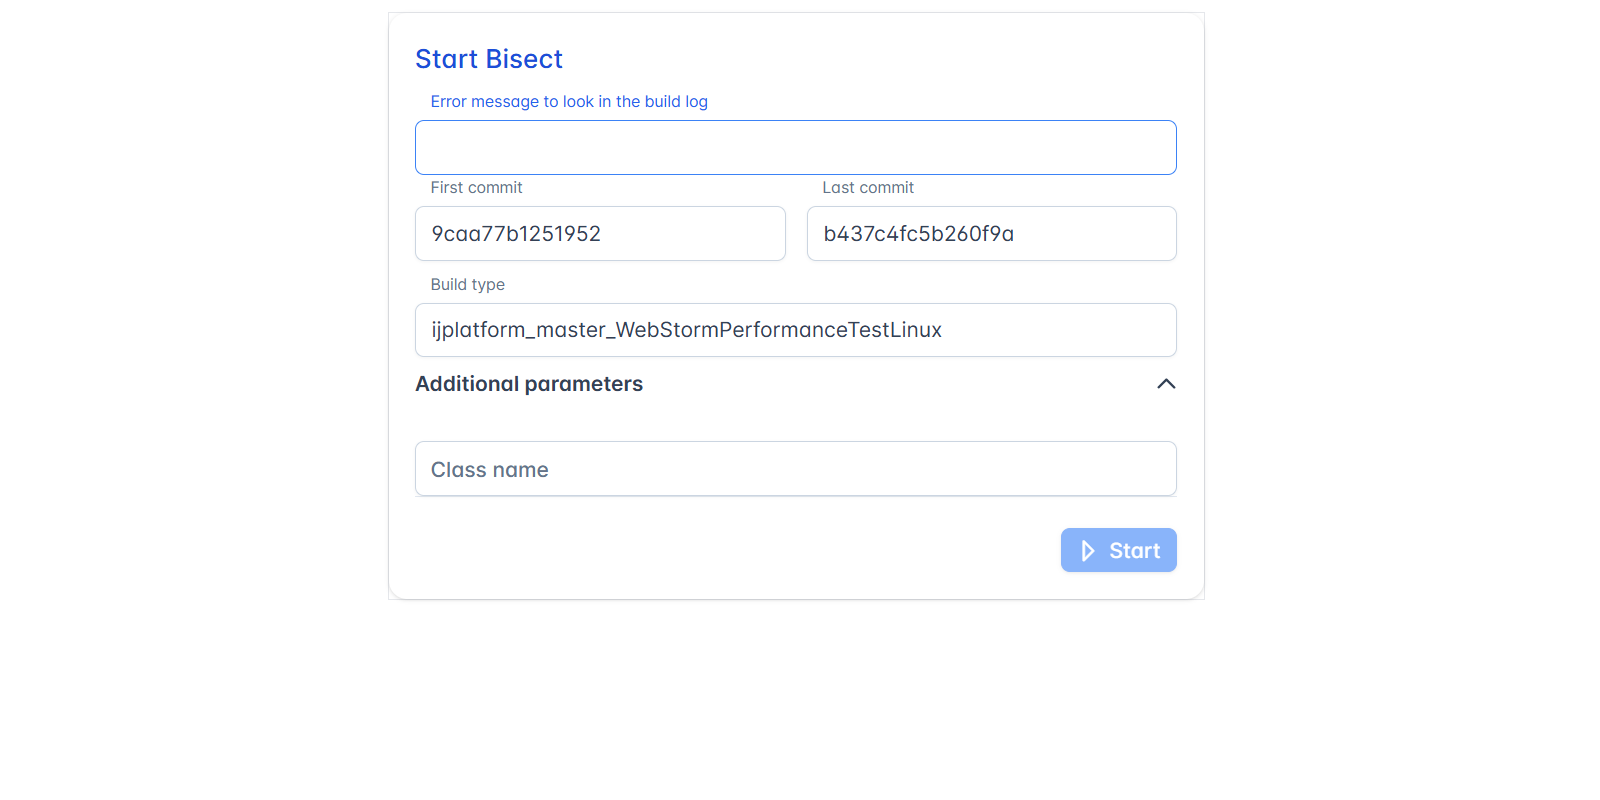
We’ve even added custom workflows like bisect runs (thanks to contributions from multiple teams) to help narrow down the exact change that introduced a slowdown.
Detecting performance degradations – early and often
Some regressions are predictable – others are a bit sneakier. They might appear after a low-level platform update, a third-party change, or even a “fix” that improves correctness but impacts performance. That’s why we track performance continuously across builds using a mix of automated alerts, visual monitoring, and manual investigation.
For unit and integration performance tests, we have Slack notifications set up so that the team is alerted immediately if something drops below baseline. But for higher-level tests, it’s often faster and more effective to visually inspect performance graphs in IJ-Perf and trust our experience to spot anomalies. Sometimes a slowdown isn’t a bug at all, but just a side effect of a necessary change.
Once we spot something, we use a set of internal tools to speed up the investigation:
- One-click YouTrack issue creation with all relevant information for investigation attached (the list of commits, CPU snapshots before and after the change, and the percentage increase or decrease).
- The bisect button helps trigger tests against a specific set of commits and find the commit that caused a change on the IJ-Perf charts.
Finding out what caused a regression is often trickier than seeing that one happened. But with the right mix of automation and human insight, we get there – and fix it.
Real projects, real insights
One of the most valuable sources of insight is our users.
Whenever you send us reproducible examples or open-source projects where performance is noticeably off, it helps us immensely. These real-world setups often become part of our testing suite, which means your contributions help improve performance for everyone.
We also get invaluable help from the community. Just recently, a user spotted and fixed a performance issue on their own. After reviewing the fix, we found it not only solid, but applicable across many projects. (Okay, full disclosure: the user was an ex-JetBrains developer. But still – once a JetBrains dev, always a JetBrains dev).
The hardest part? Reproducing the bug
Performance issues are notoriously hard to reproduce. They depend on many variables, like project size, installed plugins, system specs, and sometimes even specific coding habits. This is the main reason why we sometimes still release our products with performance bugs despite having tools set up to monitor performance.
We don’t have a magic tool (yet) to make this easier, so reproduction usually comes down to good old-fashioned sharing, whether it’s a project, a detailed list of steps, or a video. We know that takes time and effort, so when you take the time to send us something reproducible, it really helps, and we’re genuinely grateful.
What’s next?
We’re not stopping here. There are several ongoing initiatives aimed at improving performance across the board. The WebStorm team is focusing on:
- Analyzing real-world CPU snapshots submitted by users to identify and resolve bottlenecks.
- Detecting out-of-memory issues in the TypeScript language service and prompting users to increase the heap size when needed.
- Experimenting with a service-based type engine, which improves performance in some project types, though the results vary. We’re still evaluating its overall impact.
On the platform side, there are broader efforts and approaches, including better memory diagnostics and more granular, opt-in telemetry that helps us understand where time and resources are being spent.
These changes may be incremental, but performance work often is. We’re committed to continuing it, release after release.
We’re in this together
Performance isn’t just a one-time fix – it’s an ongoing commitment. We know there’s always more to do, and we’re constantly listening, measuring, and improving. If you’ve experienced slowdowns or have a project that reproduces a performance hiccup, please don’t hesitate to reach out to us.
Every bug we squash and optimization we make adds to a smoother experience for everyone using WebStorm.
Thanks for choosing WebStorm. We’ll keep pushing to make it better.
The WebStorm team