


![How to search for Maryland tech jobs that don't require a clearance? [closed]](https://cdn.sstatic.net/Sites/workplace/Img/apple-touch-icon@2.png?v=d39b333f5c58)


I Built a 3D Global Radio Map with Next.js and Three.js
I want to share how I developed Vibe Radio, a project that places radio stations from around the world on an interactive 3D globe. It was a fascinating journey where I learned a lot about 3D visualization, Three.js, and managing geographic data. Tech Stack Next.js for the frontend Three.js via React Three Fiber for 3D graphics TypeScript Radio Browser API for station data Tailwind CSS for styling The Most Interesting Challenges Creating the 3D Globe The core of ViberRadio is the interactive 3D globe. Building it involved several fascinating challenges: // Earth component with continuous rotation and stations const Earth = ({ stations }: { stations: Station[] }) => { const earthRef = useRef(null); const globeGroupRef = useRef(null); // Load textures const textures = useTexture({ earthTexture: "/earth-texture.jpg", cloudsTexture: "/clouds-texture.png", }); // Continuous rotation animation useFrame(() => { if (globeGroupRef.current) { // Rotate the entire group globeGroupRef.current.rotation.y += 0.0005; } }); // ...rest of the component } Mapping Coordinates to 3D Space One of the most interesting technical challenges was converting latitude and longitude coordinates to positions on the 3D sphere: const latLngToPosition = ( lat: number, lng: number, radius: number = 1 ): [number, number, number] => { const phi = (90 - lat) * (Math.PI / 180); const theta = (lng + 180) * (Math.PI / 180); const x = -radius * Math.sin(phi) * Math.cos(theta); const y = radius * Math.cos(phi); const z = radius * Math.sin(phi) * Math.sin(theta); return [x, y, z]; }; This mathematical transformation takes a station's geographic coordinates and places it precisely on the globe's surface. It was exciting to see stations appear exactly where they should be in the world! What I Learned This project taught me a powerful lesson: everything is possible today. With the right mindset, AI tools like Cursor and Claude 3.7 Sonnet, and a willingness to build step-by-step, you can create projects that once felt out of reach. Even complex applications like 3D visualization, real-time data management, and interactive maps become achievable if you break the process down and trust the journey. You don't have to know everything from the start, you just have to start. If you have an idea in your mind, go for it. Build it, experiment, and let the tools and technology help you evolve along the way. Try It Out! Visit Vibe Radio to explore radio stations from around the world. Click on any dot to tune in to that station! The project is fully open-source:
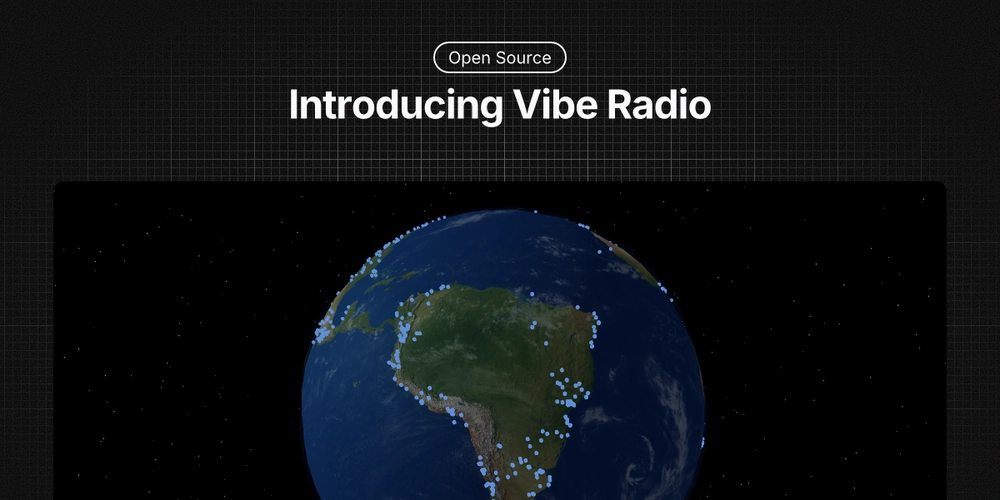
I want to share how I developed Vibe Radio, a project that places radio stations from around the world on an interactive 3D globe.
It was a fascinating journey where I learned a lot about 3D visualization, Three.js, and managing geographic data.
Tech Stack
- Next.js for the frontend
- Three.js via React Three Fiber for 3D graphics
- TypeScript
- Radio Browser API for station data
- Tailwind CSS for styling
The Most Interesting Challenges
Creating the 3D Globe
The core of ViberRadio is the interactive 3D globe. Building it involved several fascinating challenges:
// Earth component with continuous rotation and stations
const Earth = ({ stations }: { stations: Station[] }) => {
  const earthRef = useRef(null);
  const globeGroupRef = useRef(null);

  // Load textures
  const textures = useTexture({
    earthTexture: "/earth-texture.jpg",
    cloudsTexture: "/clouds-texture.png",
  });

  // Continuous rotation animation
  useFrame(() => {
    if (globeGroupRef.current) {
      // Rotate the entire group
      globeGroupRef.current.rotation.y += 0.0005;
    }
  });

  // ...rest of the component
}
Mapping Coordinates to 3D Space
One of the most interesting technical challenges was converting latitude and longitude coordinates to positions on the 3D sphere:
const latLngToPosition = (
  lat: number,
  lng: number,
  radius: number = 1
): [number, number, number] => {
  const phi = (90 - lat) * (Math.PI / 180);
  const theta = (lng + 180) * (Math.PI / 180);

  const x = -radius * Math.sin(phi) * Math.cos(theta);
  const y = radius * Math.cos(phi);
  const z = radius * Math.sin(phi) * Math.sin(theta);

  return [x, y, z];
};
This mathematical transformation takes a station's geographic coordinates and places it precisely on the globe's surface.
It was exciting to see stations appear exactly where they should be in the world!
What I Learned
This project taught me a powerful lesson: everything is possible today.
With the right mindset, AI tools like Cursor and Claude 3.7 Sonnet, and a willingness to build step-by-step, you can create projects that once felt out of reach.
Even complex applications like 3D visualization, real-time data management, and interactive maps become achievable if you break the process down and trust the journey.
You don't have to know everything from the start, you just have to start.
If you have an idea in your mind, go for it. Build it, experiment, and let the tools and technology help you evolve along the way.
Try It Out!
Visit Vibe Radio to explore radio stations from around the world.
Click on any dot to tune in to that station!
The project is fully open-source: