Essential Tools for JetBrains IDE Plugin Development: Livestream Recording and Key Takeaways
The recording of our livestream is available on JetBrains TV! In the recent session, IntelliJ Platform Developer Advocates Yann Cébron and Jakub Chrzanowski explored some of the most helpful tools for developing plugins for JetBrains IDEs. From plugin creation to UI debugging, the session covered practical tips and tricks to enhance your workflow. Let’s take […]

The recording of our livestream is available on JetBrains TV!
In the recent session, IntelliJ Platform Developer Advocates Yann Cébron and Jakub Chrzanowski explored some of the most helpful tools for developing plugins for JetBrains IDEs. From plugin creation to UI debugging, the session covered practical tips and tricks to enhance your workflow.
Let’s take a closer look at the main tools covered in the streamline. Whether you’re just getting started or have extensive experience in plugin development, exploring how these tools are used in practice can offer valuable insights and help you work more efficiently.
Plugin DevKit: Smarter Plugin XML Authoring

The Plugin DevKit has been a core tool for nearly two decades—but recent enhancements make it more powerful than ever. Developers can now benefit from:
- In-editor documentation: Hover over plugin XML tags and attributes to view the corresponding documentation directly inside the IDE.
- Improved completion and navigation: Extension points, language IDs, and Action IDs all offer rich auto-completion and go-to-declaration functionality.
- Extension point insights: Built-in links to the IntelliJ Platform Explorer let you discover how open source plugins use specific extension points.
- Internationalization support: Inspections suggest extracting hardcoded text into resource bundles, helping your plugin scale globally.
- Enhanced inspections: Spot missing plugin icons, enforce text capitalization rules, and verify extension point setup through a growing list of dedicatedinspections.
New inspections like Can Be Dumb Aware help you ensure your plugin functions even during indexing mode—offering a smoother user experience.
PSI Viewer: Understand Your Language’s Syntax Tree

When working with custom languages or extending existing ones, the PSI Viewer becomes essential. This tool provides a deep view into:
- The structure of your code’s syntax tree.
- Reference relationships and injected languages.
- Formatting models (block structure).
- Stub structures used for fast resolving.
There are two PSI viewers:
- A standalone plugin with a dockable tool window.
- A built-in viewer accessible from the Internal Tools menu.
Both help developers navigate and debug PSI elements in real-time.
UI Inspector: Explore and Debug the Plugin Interface

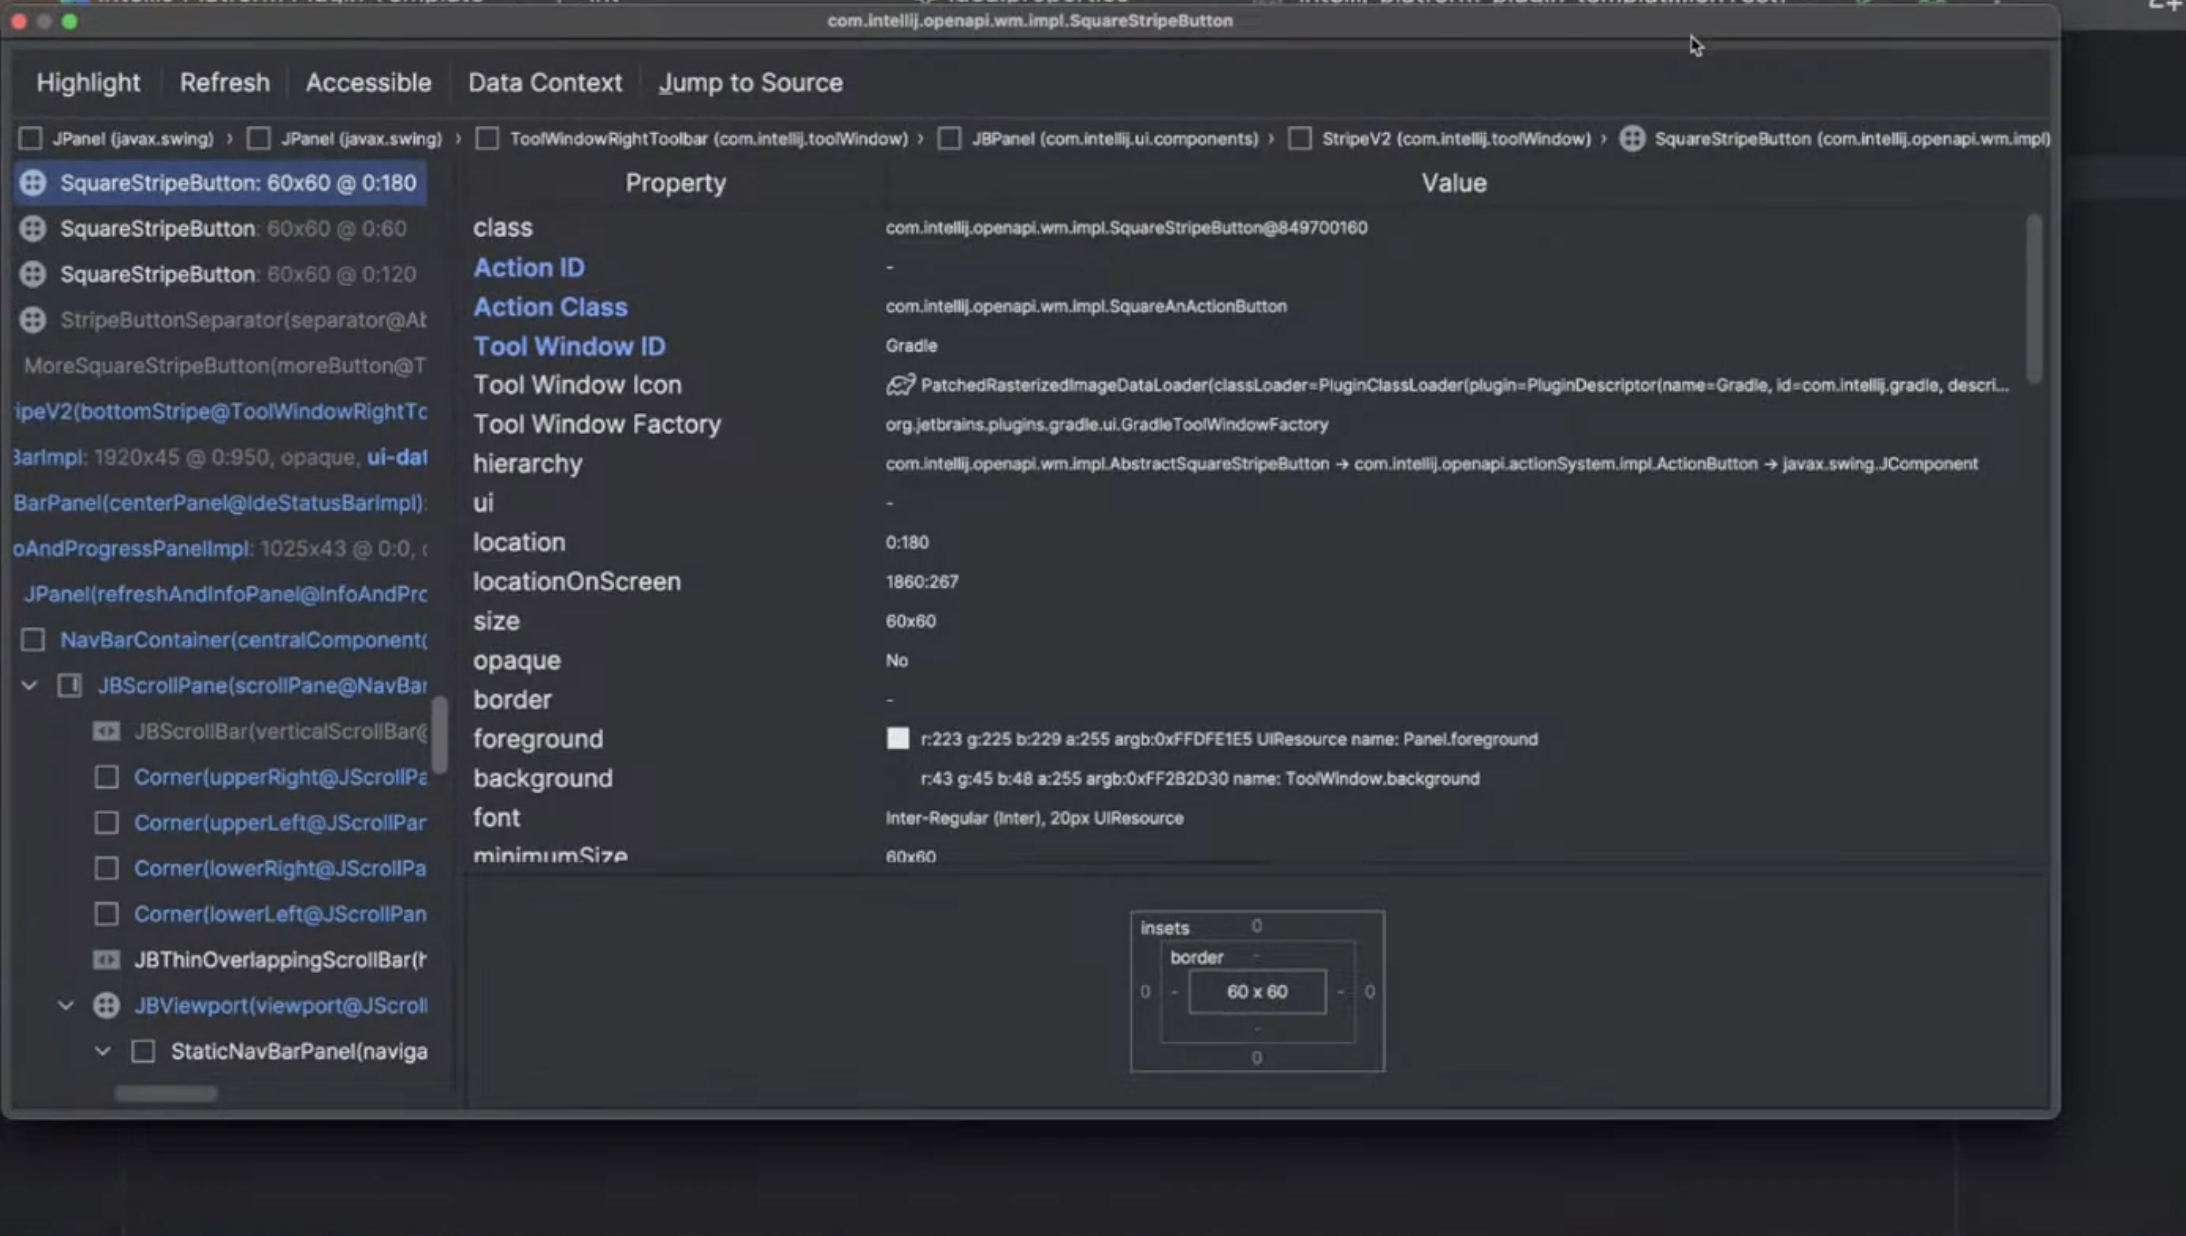
Think of the UI Inspector as the “DevTools” of the IntelliJ UI. Once you enable internal mode, you can:
- Inspect any UI element via shortcut (Ctrl+Alt+Click / ⌃⌥Click).
- View Swing properties, padding, Action IDs, and tool window IDs.
- Modify certain UI parameters in real time (e.g., layout properties).
It’s especially useful for:
- Designing themes and custom UIs.
- Looking up existing implementations as reference.
- Referencing UI elements programmatically in integration tests.
- Debugging visual layout or behavior inconsistencies.
Index Viewer Plugin: Debug Your Plugin’s Indexes

Indexes are the hidden backbone of IntelliJ’s speed and smarts. With the Index Viewer Plugin, you can:
- Inspect all file-based and stub indexes.
- Browse index contents, keys, and their associated data.
- Open index implementations and trace what they store.
- Use the “Show Index for File” option to see which indexes reference a given file.
This is invaluable for debugging custom indexes, ensuring correct data collection, and optimizing performance.
Wrapping Up
Mastering the right tools is key to building high-quality, efficient plugins for JetBrains IDEs. From fine-tuning your plugin XML to navigating complex UI testing and PSI inspection, having a strong command of the available utilities can make a big difference in your workflow and the end-user experience.
Stay tuned—we’ll be exploring even more plugin development tools in future sessions.
Have an idea for our next streamline? Let us know in the comments below!


