


![‘Yellowjackets’ Stars on Filming [SPOILER]’s ‘Heartbreaking’ Death in Episode 6 and Why It Needed to Happen That Way](https://variety.com/wp-content/uploads/2025/03/Yellowjackts_306_CB_0809_1106_RT.jpg?#)


Building a Scalable & Secure ELK Stack Infrastructure – A Practical Guide
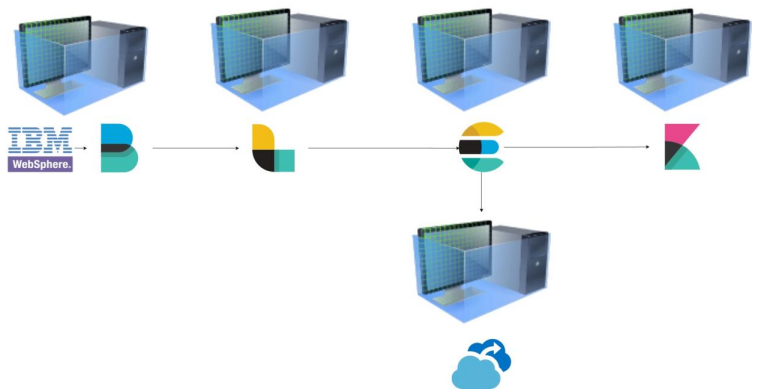
Managing logs efficiently is critical for monitoring, troubleshooting, and security compliance in any modern IT environment. The ELK stack (Elasticsearch, Logstash, Kibana) provides a powerful, scalable, and real-time logging solution, whether deployed on-premise or in the cloud. In this guide, I’ll walk you through how to design and deploy a centralized log management system using ELK, covering architecture, best practices, and key optimizations. Why Centralized Logging? Handling logs across multiple applications and servers can be a nightmare. A centralized logging system helps: Aggregate logs from multiple sources Ensure real-time monitoring and alerting Improve security compliance (e.g., encryption, access control) Optimize performance and storage Architecture Overview: Key Components A robust ELK architecture consists of multiple components working together: Filebeat → Collects logs from various sources Logstash → Processes, filters, and enriches log data Elasticsearch → Stores and indexes logs for fast retrieval Kibana → Provides real-time dashboards and analytics Backup & Security Measures → Ensures compliance and disaster recovery Example Deployment (On-Premise or Cloud-based) A large-scale financial institution handling millions of transactions daily requires centralized log management to track system activity, detect fraud, and ensure compliance with regulations like PSI-DSS and GDPR. The logging infrastructure must be scalable, resilient, and secure, capable of processing high volumes of structured and unstructured logs from multiple applications, security tools, and databases. To meet these demands, the ELK stack is deployed across dedicated virtual machines (VMs) or containers with optimized resource allocation:
Managing logs efficiently is critical for monitoring, troubleshooting, and security compliance in any modern IT environment. The ELK stack (Elasticsearch, Logstash, Kibana) provides a powerful, scalable, and real-time logging solution, whether deployed on-premise or in the cloud.
In this guide, I’ll walk you through how to design and deploy a centralized log management system using ELK, covering architecture, best practices, and key optimizations.
Why Centralized Logging?
Handling logs across multiple applications and servers can be a nightmare. A centralized logging system helps:
- Aggregate logs from multiple sources
- Ensure real-time monitoring and alerting
- Improve security compliance (e.g., encryption, access control)
- Optimize performance and storage
Architecture Overview: Key Components
A robust ELK architecture consists of multiple components working together:
- Filebeat → Collects logs from various sources
- Logstash → Processes, filters, and enriches log data
- Elasticsearch → Stores and indexes logs for fast retrieval
- Kibana → Provides real-time dashboards and analytics
- Backup & Security Measures → Ensures compliance and disaster recovery
Example Deployment (On-Premise or Cloud-based)
A large-scale financial institution handling millions of transactions daily requires centralized log management to track system activity, detect fraud, and ensure compliance with regulations like PSI-DSS and GDPR. The logging infrastructure must be scalable, resilient, and secure, capable of processing high volumes of structured and unstructured logs from multiple applications, security tools, and databases.
To meet these demands, the ELK stack is deployed across dedicated virtual machines (VMs) or containers with optimized resource allocation: