


Where to Buy Real Estate in Canada 2025: National overview
These are the regions and neighbourhoods offering the best long-term value for home buyers, based on affordability, price trends and other factors. The post Where to Buy Real Estate in Canada 2025: National overview appeared first on MoneySense.

After two relatively subdued years for the Canadian real estate market, 2024 was supposed to mark the return of a much busier and more competitive market.
At the start of 2024, home buyers awaited signs that the Bank of Canada (BoC) would cut interest rates for the first time in years. But the spring real estate season came and went with no change in the benchmark rate.
Then, in June 2024, when the BoC lowered its rate for the first time since 2020, the impact on buyer sentiment was minimal. The Bank made further rate cuts in July, September, October and December, reducing the benchmark rate by a total of 175 basis points (equal to 1.75 percentage points). Yet these moves didn’t fully re-energize the market, either.
Meanwhile, muted home buyer demand led to an increase in Canada’s supply of homes for sale. Nationally, months of housing inventory reached 4.4 in May—the highest level since May 2020, according to the Canadian Real Estate Association (CREA). The extra supply of homes gave buyers more choice, and sellers less negotiating power, helping to maintain a relatively balanced real estate market for much of the year.
When 2025 arrived, inflation was under control and the BoC appeared to be nearing the end of its rate-cutting cycle. Easing home prices and falling mortgage rates were expected to unlock pent-up buyer demand throughout the year. However, the threat of widespread U.S. tariffs has dampened buyer sentiment and raised questions about the BoC’s next moves. On the positive side, home affordability has improved in many parts of Canada over the last year.
So, where are the best places to buy a home in 2025? Find out in the latest edition of Where to Buy Real Estate in Canada. The annual ranking has evolved since MoneySense first launched it in 2009. This year’s was created in partnership with Zoocasa, an award-winning consumer real estate search platform. Zoocasa analyzed real estate data to reveal the best cities and regions to buy property in Canada, as well as the top neighbourhoods in Vancouver, Calgary, Edmonton, Toronto and the Greater Toronto Area.
- Top neighbourhoods in Toronto, Ont.
- Top neighbourhoods in the Greater Toronto Area
- Top neighbourhoods in Edmonton, Alta.
- Top neighbourhoods in Calgary, Alta.
- Top neighbourhoods in Vancouver, B.C.
- All neighbourhood data for 2025
- Where to Buy Real Estate in Canada: 2024
- Where to Buy Real Estate in Canada: 2023
- Where to Buy Real Estate in Canada: 2022
- Where to Buy Real Estate in Canada: 2021
- Quickly find the best mortgage rates available in Canada, including the best five-year fixed and five-year variable rates.
- Figure out how much mortgage you can afford.
- See what your mortgage payment would be if you bought a home in the Calgary.
- Calculate the cost of breaking or renewing your current mortgage.
- Read our guides to buying a first home and buying a second home in Canada.
You’re 2 minutes away from getting the best mortgage rates.
Answer a few quick questions to get a personalized quote, whether you’re buying, renewing or refinancing.
Best places to buy real estate: National overview
Here are the best places to buy real estate in Canada in 2025, based on Zoocasa’s analysis of data from 44 different regions. To view all the results, slide the columns right or left using your fingers or mouse, or download the data to your device in Excel, CSV or PDF format. For questions about how to understand the data, read our detailed methodology.
| wdt_ID | wdt_created_by | wdt_created_at | wdt_last_edited_by | wdt_last_edited_at | Rank | Region | Province | Benchmark price (2024) | 1-year | 3-year | 5-year | Median after-tax income | Safety index | Health care index | Value score | National average (+/-) |
|---|---|---|---|---|---|---|---|---|---|---|---|---|---|---|---|---|
| 1 | Luca Tatulli | 18/03/2025 11:27 AM | Luca Tatulli | 18/03/2025 11:27 AM | 1 | Fredericton | N.B. | $310,925 | 11% | 32% | 72% | $69,000 | 67.28 | 55.90 | 3.74 | -$408,417 |
| 2 | Luca Tatulli | 18/03/2025 11:27 AM | Luca Tatulli | 18/03/2025 11:27 AM | 2 | Calgary | Alta. | $577,367 | 8% | 29% | 41% | $87,000 | 61.61 | 73.98 | 3.69 | -$141,975 |
| 3 | Luca Tatulli | 18/03/2025 11:27 AM | Luca Tatulli | 18/03/2025 11:27 AM | 3 | Saint John | N.B. | $311,225 | 9% | 34% | 71% | $56,800 | 57.10 | 71.80 | 3.55 | -$408,117 |
| 4 | Luca Tatulli | 18/03/2025 11:27 AM | Luca Tatulli | 18/03/2025 11:27 AM | 4 | Greater Moncton | N.B. | $357,225 | 9% | 42% | 107% | $65,500 | 51.29 | 64.17 | 3.47 | -$362,117 |
| 5 | Luca Tatulli | 18/03/2025 11:27 AM | Luca Tatulli | 18/03/2025 11:27 AM | 5 | Edmonton | Alta. | $391,458 | 6% | 7% | 15% | $84,000 | 53.62 | 77.11 | 3.44 | -$327,883 |
| 6 | Luca Tatulli | 18/03/2025 11:27 AM | Justin Dallaire | 23/04/2025 11:38 AM | 6 | St John’s | N.L. | $348,658 | 7% | 19% | 28% | $72,500 | 53.82 | 61.71 | 3.26 | -$370,683 |
| 7 | Luca Tatulli | 18/03/2025 11:27 AM | Luca Tatulli | 18/03/2025 11:27 AM | 7 | Rideau St. Lawrence | Ont. | $557,833 | 3% | 8% | 75% | $74,500 | 60.85 | 77.61 | 3.17 | -$161,508 |
| 8 | Luca Tatulli | 18/03/2025 11:27 AM | Luca Tatulli | 18/03/2025 11:27 AM | 8 | Ottawa | Ont. | $640,508 | 1% | 3% | 50% | $84,000 | 69.02 | 68.60 | 3.16 | -$78,833 |
| 9 | Luca Tatulli | 18/03/2025 11:27 AM | Luca Tatulli | 18/03/2025 11:27 AM | 9 | Kingston area | Ont. | $556,750 | 2% | 8% | 57% | $73,500 | 60.85 | 77.61 | 3.13 | -$162,592 |
| 10 | Luca Tatulli | 18/03/2025 11:27 AM | Luca Tatulli | 18/03/2025 11:27 AM | 10 | Saskatoon | Sask. | $396,200 | 6% | 15% | 29% | $77,500 | 48.70 | 64.49 | 3.12 | -$323,142 |
| 11 | Luca Tatulli | 18/03/2025 11:27 AM | Luca Tatulli | 18/03/2025 11:27 AM | 11 | Montreal metro area | Que. | $534,750 | 5% | 14% | 54% | $65,500 | 67.34 | 61.91 | 3.11 | -$184,592 |
| 12 | Luca Tatulli | 18/03/2025 11:27 AM | Luca Tatulli | 18/03/2025 11:27 AM | 12 | Halifax-Dartmouth | N.S. | $537,617 | 3% | 23% | 79% | $69,500 | 58.95 | 65.87 | 3.10 | -$181,725 |
| 13 | Luca Tatulli | 18/03/2025 11:27 AM | Luca Tatulli | 18/03/2025 11:27 AM | 13 | Vancouver Island | B.C. | $688,442 | 3% | 14% | 58% | $83,000 | 53.43 | 80.56 | 3.07 | -$30,900 |
| 14 | Luca Tatulli | 18/03/2025 11:27 AM | Luca Tatulli | 18/03/2025 11:27 AM | 14 | Sault Ste. Marie | Ont. | $296,933 | 6% | 29% | 85% | $65,500 | 39.82 | 62.75 | 3.01 | -$422,408 |
| 15 | Luca Tatulli | 18/03/2025 11:27 AM | Luca Tatulli | 18/03/2025 11:27 AM | 15 | Regina | Sask. | $315,733 | 3% | 3% | 14% | $78,500 | 46.85 | 66.34 | 2.99 | -$403,608 |
| 16 | Luca Tatulli | 18/03/2025 11:27 AM | Luca Tatulli | 18/03/2025 11:27 AM | 16 | Cambridge | Ont. | $745,742 | -0.3% | -0.2% | 54% | $82,000 | 68.05 | 73.50 | 2.96 | $26,400 |
| 17 | Luca Tatulli | 18/03/2025 11:27 AM | Luca Tatulli | 18/03/2025 11:27 AM | 17 | Winnipeg | Man. | $356,625 | 5% | 9% | 28% | $71,500 | 39.56 | 68.57 | 2.84 | -$362,717 |
| 18 | Luca Tatulli | 18/03/2025 11:27 AM | Luca Tatulli | 18/03/2025 11:27 AM | 18 | North Bay | Ont. | $413,967 | 6% | 24% | 86% | $64,500 | 37.41 | 67.72 | 2.80 | -$305,375 |
| 19 | Luca Tatulli | 18/03/2025 11:27 AM | Luca Tatulli | 18/03/2025 11:27 AM | 19 | Oakville-Milton | Ont. | $1,258,242 | -3% | 0.2% | 37% | $108,000 | 73.65 | 74.07 | 2.76 | $538,900 |
| 20 | Luca Tatulli | 18/03/2025 11:27 AM | Luca Tatulli | 18/03/2025 11:27 AM | 20 | Simcoe district | Ont. | $561,258 | 1% | 3% | 58% | $82,000 | 56.59 | 57.41 | 2.75 | -$158,083 |
| 21 | Luca Tatulli | 18/03/2025 11:27 AM | Luca Tatulli | 18/03/2025 11:27 AM | 21 | Peterborough and Kawarthas | Ont. | $672,392 | 3% | 6% | 52% | $70,500 | 50.68 | 78.09 | 2.72 | -$46,950 |
| 22 | Luca Tatulli | 18/03/2025 11:27 AM | Luca Tatulli | 18/03/2025 11:27 AM | 22 | Barrie district | Ont. | $796,775 | -0.4% | 3% | 62% | $85,000 | 59.17 | 69.13 | 2.71 | $77,433 |
| 23 | Luca Tatulli | 18/03/2025 11:27 AM | Luca Tatulli | 18/03/2025 11:27 AM | 23 | Guelph district | Ont. | $804,617 | -2% | 1% | 46% | $84,000 | 65.64 | 64.13 | 2.68 | $85,275 |
| 24 | Luca Tatulli | 18/03/2025 11:27 AM | Luca Tatulli | 18/03/2025 11:27 AM | 24 | Kawartha Lakes | Ont. | $673,083 | 0% | 4% | 59% | $72,500 | 50.68 | 78.09 | 2.65 | -$46,258 |
| 25 | Luca Tatulli | 18/03/2025 11:27 AM | Luca Tatulli | 18/03/2025 11:27 AM | 25 | Windsor-Essex | Ont. | $578,550 | 1% | 5% | 59% | $73,000 | 54.50 | 59.91 | 2.63 | -$140,792 |
| 26 | Luca Tatulli | 18/03/2025 11:27 AM | Luca Tatulli | 18/03/2025 11:27 AM | 26 | Huron-Perth | Ont. | $572,175 | 2% | 6% | 65% | $70,000 | 46.06 | 67.25 | 2.54 | -$147,167 |
| 27 | Luca Tatulli | 18/03/2025 11:27 AM | Luca Tatulli | 18/03/2025 11:27 AM | 27 | Lakelands | Ont. | $700,667 | -2% | 0.03% | 53% | $73,000 | 58.95 | 65.87 | 2.53 | -$18,675 |
| 28 | Luca Tatulli | 18/03/2025 11:27 AM | Luca Tatulli | 18/03/2025 11:27 AM | 28 | Kitchener-Waterloo | Ont. | $732,675 | -2% | -2% | 49% | $81,000 | 57.06 | 65.33 | 2.52 | $13,333 |
| 29 | Luca Tatulli | 18/03/2025 11:27 AM | Luca Tatulli | 18/03/2025 11:27 AM | 29 | Grey-Bruce-Owen Sound | Ont. | $567,950 | 1% | 5% | 60% | $57,600 | 47.54 | 76.09 | 2.50 | -$151,392 |
| 30 | Luca Tatulli | 18/03/2025 11:27 AM | Luca Tatulli | 18/03/2025 11:27 AM | 30 | Niagara Region | Ont. | $638,892 | -1% | -1% | 54% | $67,500 | 55.25 | 66.27 | 2.44 | -$80,450 |
| 31 | Luca Tatulli | 18/03/2025 11:27 AM | Luca Tatulli | 18/03/2025 11:27 AM | 31 | London-St. Thomas | Ont. | $608,067 | 1% | 1% | 61% | $71,000 | 46.06 | 67.25 | 2.43 | -$111,275 |
| 32 | Luca Tatulli | 18/03/2025 11:27 AM | Luca Tatulli | 18/03/2025 11:27 AM | 32 | Tillsonburg district | Ont. | $584,508 | 2% | 9% | 83% | $66,000 | 41.60 | 66.67 | 2.40 | -$134,833 |
| 33 | Luca Tatulli | 18/03/2025 11:27 AM | Luca Tatulli | 18/03/2025 11:27 AM | 33 | Greater Toronto Area | Ont. | $1,087,700 | -2% | 6% | 43% | $85,000 | 56.37 | 74.14 | 2.33 | $368,358 |
| 34 | Luca Tatulli | 18/03/2025 11:27 AM | Luca Tatulli | 18/03/2025 11:27 AM | 34 | Mississauga | Ont. | $1,068,283 | -2% | -1% | 34% | $89,000 | 56.62 | 69.94 | 2.28 | $348,942 |
| 35 | Luca Tatulli | 18/03/2025 11:27 AM | Luca Tatulli | 18/03/2025 11:27 AM | 35 | Hamilton-Burlington | Ont. | $836,175 | -1% | -1% | 45% | $80,000 | 44.11 | 75.61 | 2.28 | $116,833 |
| 36 | Luca Tatulli | 18/03/2025 11:27 AM | Luca Tatulli | 18/03/2025 11:27 AM | 36 | Victoria | B.C. | $865,183 | 0.0% | 9% | 40% | $60,000 | 58.88 | 66.14 | 2.27 | $145,842 |
| 37 | Luca Tatulli | 18/03/2025 11:27 AM | Luca Tatulli | 18/03/2025 11:27 AM | 37 | Woodstock-Ingersoll | Ont. | $634,733 | -1% | 0.3% | 62% | $73,000 | 41.60 | 66.67 | 2.26 | -$84,608 |
| 38 | Luca Tatulli | 18/03/2025 11:27 AM | Luca Tatulli | 18/03/2025 11:27 AM | 38 | Brantford Region | Ont. | $677,725 | -1% | 2% | 61% | $76,000 | 39.15 | 69.19 | 2.26 | -$41,617 |
| 39 | Luca Tatulli | 18/03/2025 11:27 AM | Luca Tatulli | 18/03/2025 11:27 AM | 39 | Greater Vancouver | B.C. | $1,188,492 | 1% | 9% | 32% | $79,500 | 57.17 | 71.96 | 2.23 | $469,150 |
| 40 | Luca Tatulli | 18/03/2025 11:27 AM | Luca Tatulli | 18/03/2025 11:27 AM | 40 | Chilliwack district | B.C. | $737,383 | 2% | 4% | 49% | $74,000 | 37.81 | 58.99 | 2.05 | $18,042 |
| 41 | Luca Tatulli | 18/03/2025 11:27 AM | Luca Tatulli | 18/03/2025 11:27 AM | 41 | Northumberland Hills | Ont. | $622,683 | -13% | -8% | 41% | $74,500 | 39.95 | 79.43 | 2.03 | -$96,658 |
| 42 | Luca Tatulli | 18/03/2025 11:27 AM | Luca Tatulli | 18/03/2025 11:27 AM | 42 | Fraser Valley | B.C. | $990,900 | -1% | 8% | 46% | $77,500 | 41.75 | 65.84 | 1.95 | $271,558 |
| 43 | Luca Tatulli | 18/03/2025 11:27 AM | Luca Tatulli | 18/03/2025 11:27 AM | 43 | Quinte district | Ont. | $575,100 | 1% | 4% | 66% | $72,500 | 42.21 | 26.44 | 1.79 | -$144,242 |
| 44 | Luca Tatulli | 18/03/2025 11:27 AM | Luca Tatulli | 18/03/2025 11:27 AM | 44 | Bancroft area | Ont. | $517,558 | 3% | 11% | 81% | $52,800 | 42.21 | 26.44 | 1.72 | -$201,783 |
Source: Zoocasa
What’s shaping the Canadian real estate market in 2025?
In 2024, home buyers remained cautious, as many waited for mortgage interest rates to fall. While borrowing costs did decrease throughout the year, many prospective buyers held off on buying until they were confident that rates had reached their lowest point.
“The typical urgency to enter the spring market diminished in 2024,” says Carrie Lysenko, chief executive officer of Zoocasa. “This widespread hesitancy fostered a rare balance in the housing market—buyers re-engaged at a measured pace, which maintained a stable equilibrium between supply and demand that we hadn’t seen in years. With rates expected to stabilize in 2025, buyers will be emboldened with more confidence in their borrowing decisions.”
At the start of 2025, the average five-year fixed mortgage rate was just above 4%, marking a refreshing change from a year earlier, when it was closer to 5%. Consecutive rate cuts in 2024 boosted seller confidence and resulted in an increase of new listings across most major markets—momentum that has carried into 2025. From December 2024 to January 2025, new listings across Canada increased 11% month-over-month, and months of inventory jumped from 3.9 months to 4.2 months.
Meanwhile, on a national level, the number of home sales grew at a moderate pace throughout 2024. Whereas real estate activity slumped in cities across Ontario during the spring, markets in Western Canada saw increased activity. The pace of sales growth was particularly notable in Edmonton and Regina, with each market experiencing year-over-year increases of more than 50% in April.
Sales activity slowed in most markets at the beginning of 2025, but several Western Canadian cities still experienced sales breakthroughs. In January 2025, year-over-year sales surged 25% in Victoria, 12% in Edmonton and 4% in Winnipeg. In contrast, year-over-year sales dropped 9% in Toronto.
“Due to home prices maintaining relative stability in our most populated cities, home buyers are continuing to recognize the value in less saturated markets, like the Prairies. Ultimately, they are being viewed as new real estate hotspots,” explains Lysenko. “While the core areas of Toronto and Vancouver represent a significant portion of national home sales, we continue to witness a notable shift in interest as people re-evaluate their living situations and the costs associated with urban life that began in earnest during the pandemic.”
In the majority of the markets we analyzed, the average home price rose by less than 3% annually throughout 2024. Only a handful of markets, all located well beyond the Toronto and Vancouver areas, finished the year with more than a 5% year-over-year increase in average home price.
Outside of the core Toronto and Vancouver areas, the markets with the most sales growth are poised for the largest price gains this year. The Quebec Census Metropolitan Area (which encompasses Quebec City and Lévis), Regina, Saskatoon, Saint John and Edmonton have all had strong starts. Each saw a bump of over 9% in its year-over-year average home price in January. So far this year, prices have been stable in Toronto and Vancouver, but as the spring market unfolds, price growth could accelerate.
You’re 2 minutes away from getting the best mortgage rates.
Answer a few quick questions to get a personalized quote, whether you’re buying, renewing or refinancing.
Canada’s top three real estate markets in 2025
1. Fredericton, N.B.
This quaint Maritime capital has been climbing our ranking since 2022, when it came in 10th. This year, it takes the top spot with a value score of 3.74 out of 5. Fredericton ranks highly for safety and home price appreciation. It also has the second-lowest average home price on our list, behind Sault Ste. Marie, Ont.
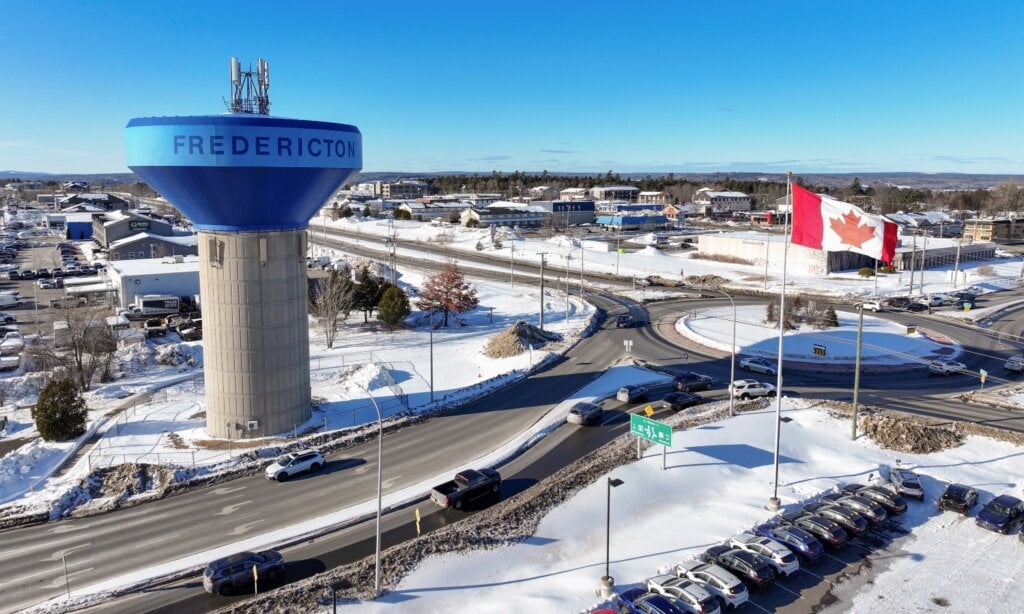
What’s happened in the Fredericton real estate market?
Fredericton is almost unrivalled for affordability, with an average home price of $310,925. That’s not to say homes aren’t appreciating rapidly. At the end of 2024, the average price was up 11% year-over-year, more than any other city analyzed. Three-year and five-year price growth were even more dramatic, at 32% and 72%, respectively.
New Brunswick’s capital is “the perfect size,” says Molly Wilby, an eXp real estate agent who was born and raised in the city. It’s big enough that residents always have something to do, yet small enough to feel safe, she says. “With competitive prices and a rich cultural scene, it’s a great option for first-time home buyers.” (Zoocasa, the author of this study, is wholly owned by eXp World Holdings.)
Out-of-province buyers flocked to New Brunswick after the pandemic, but Wilby says that trend has slowed and the buyer pool is now increasingly made up of locals. “Many are former residents who left for university or work and are now coming back, often with partners from other regions.”
Buyers are drawn to the area’s accessible home prices, she says. Properties in the $250,000-to-$400,000 price range are easily the most sought-after, especially among first-time home buyers.
The region’s relative affordability has led to fierce competition and often multiple offers on properties, creating a market that has been very lucrative for sellers, adds Wilby.
What’s next for real estate in Fredericton?
With the buyer pool expanding, the relatively low number of listings will keep the market tight in 2025. Strong demand will also put upward pressure on prices, likely leading to another record year for growth. If the start of 2025 is any indication—January’s benchmark price of $338,800 exceeded last year’s by 18%—investors and sellers can expect to see a good return on their investment.
However, in a seller’s market, when supply is low and demand is high, buyers need to manage their expectations and work to stand out amid the competition.
“You really have to have your ducks in a row and be ready to rock when the time comes,” says Wilby. “This includes securing a pre-approval [on your mortgage], working with a savvy real estate agent and keeping a close eye on the market as it changes week by week.”
2. Calgary, Alta.
Canada’s third-largest city is also a major economic hub in the West. On average, homes are less affordable in Calgary compared to those in our other top-five cities and regions, having appreciated about $128,000 over three years. Fortunately, pockets of affordability remain in some Calgary neighbourhoods. With average home prices of $400,000 to $560,000, the top neighbourhoods in Calgary are growing fast, and for good reason. Read more about them in our deep dive into the Calgary real estate market.
The best places to buy in Calgary

3. Saint John, N.B.
This seaport city may have fallen one spot since last year, but it still offers some of the most affordable homes in the country. With a value score of 3.55, Saint John secured a well-deserved spot in the top three best places to buy real estate in 2025.

What’s happened in the Saint John real estate market?
At the end of 2024, Saint John’s average home price was $311,225—a whopping $400,000 below the national average, despite being up 9% from 2023. But New Brunswick’s second-largest city has a lot to offer beyond affordability and home price appreciation. It boasts a solid score on the health care index, reflecting access to quality medical professionals and resources, including the province’s largest tertiary care hospital.
“Last year, the market attracted a lot of out-of-town buyers, including returning locals and remote workers,” says Wendy Stevens, a real estate agent with eXp. “Their growing interest in Saint John has highlighted the city’s value, but it has also intensified competition.”
A persistently tight market has pushed the average home price up 34% since 2021 and 71% since 2019. “We saw significant price hikes in 2024, which felt drastic to locals, though [home buyers] from Ontario and larger cities might view the increases as less extreme,” says Stevens.
Though Saint John’s market was very busy before, particularly during and right after the pandemic, activity was beginning to cool with the decline in remote work. But Stevens says activity has intensified again recently. “The market is more competitive than ever, especially for homes in the highly sought-after $350,000 to $450,000 range, which are frequently seeing multiple offers.”
What’s next for real estate in Saint John?
In January 2025, the composite benchmark home price was $338,600, marking an increase of over $50,000 from the previous year. That’s not a small change for a city with a median after-tax income of $56,800. But price increases aren’t hindering enthusiasm.
“Though the spring market is just starting, I’m seeing an increase in interest from first-time home buyers. With lower interest rates and the availability of 30-year amortizations, home ownership is becoming more attainable for them this year,” says Stevens.
While a shortage of homes is pushing Saint John deeper into a seller’s market, Stevens is hopeful that inventory might improve this year—as it did in 2024. “I’m optimistic that as builders ramp up construction, it will help balance the market and increase inventory, giving buyers more options in the resale sector.”
Guide to the data tables
- Regions: Some geographical regions are combined, reflecting how data is reported by Canadian real estate boards. We removed areas that overlapped with wider regions, as well as areas for which the overall transaction volume was too small to be comparable.
- Benchmark price 2024: The composite benchmark price as of Dec. 31, 2024. It represents all property types, including attached and detached homes, townhouses/row units and apartment units.
- 1-year, 3-year and 5-year growth: The percentage increase or decrease in the composite benchmark price (all property types) over each time frame.
- Median after-tax income: Median after-tax income of households, according to the 2021 Census of Population.
- Safety index: Based on Numbeo’s Safety Index, which uses survey responses to gauge general perceptions of crime levels, including perceived safety during daytime and nighttime, concerns about specific crimes (robbery, car theft), and violent crime severity.
- Health care index: Based on Numbeo’s Health Care Index, which uses survey responses to assess the overall quality of local health care systems, including the availability and quality of medical professionals, equipment, staff, doctors and resources.
- Value: A score out of five, with five representing the most value. To see how we determine value, read our methodology section below.
- National average (+/-): The price difference between the area’s benchmark price and the national average, as of Dec. 31, 2024.
Methodology
Zoocasa analyzed data from real estate boards across Canada. Rankings are based on 2024 data collected in early 2025, and interviews were conducted around the same time.
National ranking
We pulled home price data for the national ranking from CREA. The geographical areas included in the study are based on data availability. CREA does not provide data for all Canadian cities and markets, meaning some areas are not covered in our report. The reported data for certain cities, such as Hamilton and Burlington in Ontario, is combined by CREA and reflects the benchmark price of the two cities combined.
We ranked regions and neighbourhoods within the same geographic area against each other. The overall rankings and scores are based on the areas’ benchmark home prices and recent real estate price growth.
Value
Our value score accounts for an area’s composite benchmark home price as of Dec. 31, 2024, relative to the overall regional average; affordable home prices contribute positively to the score.
The calculation also accounts for one-year, three-year and five-year home value growth, with more weight assigned to the most recent data. Although recent comparables are better indicators of value, a positive and steady trend of home value growth is part of the overall calculation.
In addition to real estate data, the total value score factors in a city’s median after-tax income, safety index, and health care index.
Neighbourhood rankings
In addition to home price data and value scores, our neighbourhood rankings factor in neighbourhood economics data, which we weighted equally with value.
These neighbourhood economic scores are based on factors commonly considered in economic and affordability indexes: the percentages of households that own or rent, education levels, median income and household income.
Qualitative factors
To gain further insight into each neighbourhood, we have included information on amenities and accessibility, as well as the percentage of households with children. While we did not use these factors to determine the overall ranking, they helped us assess the lifestyle in each area.
The neighbourhood accessibility scores comprise a walk score, transit score and bike score. Each factor is given a score out of 100; the three scores are weighted at 60%, 30% and 10%, respectively, for a neighbourhood accessibility score out of five.
Data sources
We used data from the following organizations: Statistics Canada, CREA, Toronto Regional Real Estate Board (TRREB), Realtors Association of Edmonton (RAE), Calgary Real Estate Board (CREB), Greater Vancouver Realtors (GVR), WalkScore and Numbeo.
Get free MoneySense financial tips, news & advice in your inbox.
Read more about buying a home:
- Mortgage affordability calculator
- The complete guide for first-time home buyers in Canada
- Where to find the first home savings account
- Buying a second home: How it works in Canada
This article was created by Zoocasa.
This is an unpaid article. It was written by a content partner based on its expertise and edited by MoneySense.
This article by presented by Ratehub.ca
This is an editorially driven article or content package, presented with financial support from an advertiser. The advertiser has no influence on the creation of the content.
The post Where to Buy Real Estate in Canada 2025: National overview appeared first on MoneySense.


