


Performance in Javascript/ReactJS: Part 2
Hey developers! Welcome to my second blog on JavaScript performance. In this post, Beforing walking you through optimizing long tasks in JavaScript in this post to prevent performance bottlenecks, I recommend reading the previous post Part 1 of performance in Javascript We'll dive into DevTools' Performance tab to analyze slow-performing functions, identify bottlenecks, and improve execution time effectively. Let’s explore how to make your JavaScript code more efficient! In Login/index.tsx file, I have added a long task function heavyComputation() { let total = 0; for (let i = 0; i < 1e9; i++) { // Heavy loop total += i; } console.log("Computation done:", total); } useEffect(() => { heavyComputation(); // UI freezes while processing console.log("Task complete!") },[]) On clicking "Event Log" tab, we can see "Function call" and on expanding it, it shows heavyComputation details (Look carefully at right side, index.tsx:203:12 Same you can see on the right side) -> It is showing exact line from where this heavy operation is happening. Total Time: ~1023ms Now we can see below
Hey developers! Welcome to my second blog on JavaScript performance.
In this post, Beforing walking you through optimizing long tasks in JavaScript in this post to prevent performance bottlenecks, I recommend reading the previous post Part 1 of performance in Javascript
We'll dive into DevTools' Performance tab to analyze slow-performing functions, identify bottlenecks, and improve execution time effectively.
Let’s explore how to make your JavaScript code more efficient!
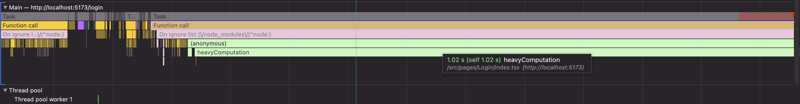
In Login/index.tsx file, I have added a long task
function heavyComputation() {
    let total = 0;
    for (let i = 0; i < 1e9; i++) {  // Heavy loop
      total += i;
    }
    console.log("Computation done:", total);
  }

    useEffect(() => {
      heavyComputation();  // UI freezes while processing
      console.log("Task complete!")
    },[])
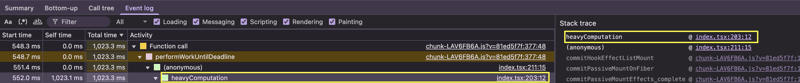
On clicking "Event Log" tab, we can see "Function call" and on expanding it, it shows heavyComputation details (Look carefully at right side, index.tsx:203:12 Same you can see on the right side) -> It is showing exact line from where this heavy operation is happening.
Total Time: ~1023ms
Now we can see below