


PCE Measure of Shelter Decreases Slightly to 4.3% YoY in March
Here is a graph of the year-over-year change in shelter from the CPI report and housing from the PCE report this morning, both through March 2025. CPI Shelter was up 4.0% year-over-year in March, down from 4.2% in February, and down from the cycle peak of 8.2% in March 2023.Housing (PCE) was up 4.3% YoY in March, down slightly from 4.3% in February and down from the cycle peak of 8.3% in April 2023. Since asking rents are mostly flat year-over-year, these measures will slowly continue to decline over the next year as rents for existing tenants continue to increase. The second graph shows PCE prices, Core PCE prices and Core ex-housing over the last 3 months (annualized): Key measures are above the Fed's target on a 3-month basis. 3-month annualized change: PCE Price Index: 3.1% Core PCE Prices: 3.5% Core minus Housing: 3.4% Note: It is likely there is still some residual seasonality distorting PCE prices in Q1.
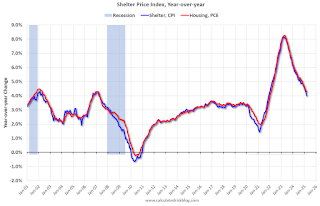
Here is a graph of the year-over-year change in shelter from the CPI report and housing from the PCE report this morning, both through March 2025.
CPI Shelter was up 4.0% year-over-year in March, down from 4.2% in February, and down from the cycle peak of 8.2% in March 2023.
 The second graph shows PCE prices, Core PCE prices and Core ex-housing over the last 3 months (annualized):
Key measures are above the Fed's target on a 3-month basis.
3-month annualized change:
Note: It is likely there is still some residual seasonality distorting PCE prices in Q1.
 CPI Shelter was up 4.0% year-over-year in March, down from 4.2% in February, and down from the cycle peak of 8.2% in March 2023.
Housing (PCE) was up 4.3% YoY in March, down slightly from 4.3% in February and down from the cycle peak of 8.3% in April 2023.
Since asking rents are mostly flat year-over-year, these measures will slowly continue to decline over the next year as rents for existing tenants continue to increase.
Since asking rents are mostly flat year-over-year, these measures will slowly continue to decline over the next year as rents for existing tenants continue to increase.
 The second graph shows PCE prices, Core PCE prices and Core ex-housing over the last 3 months (annualized):
Key measures are above the Fed's target on a 3-month basis.
3-month annualized change:
PCE Price Index: 3.1%
Core PCE Prices: 3.5%
Core minus Housing: 3.4%
Core PCE Prices: 3.5%
Core minus Housing: 3.4%
Note: It is likely there is still some residual seasonality distorting PCE prices in Q1.