


Las Vegas in January: Visitor Traffic Down 1.1% YoY; Convention Traffic Up YoY
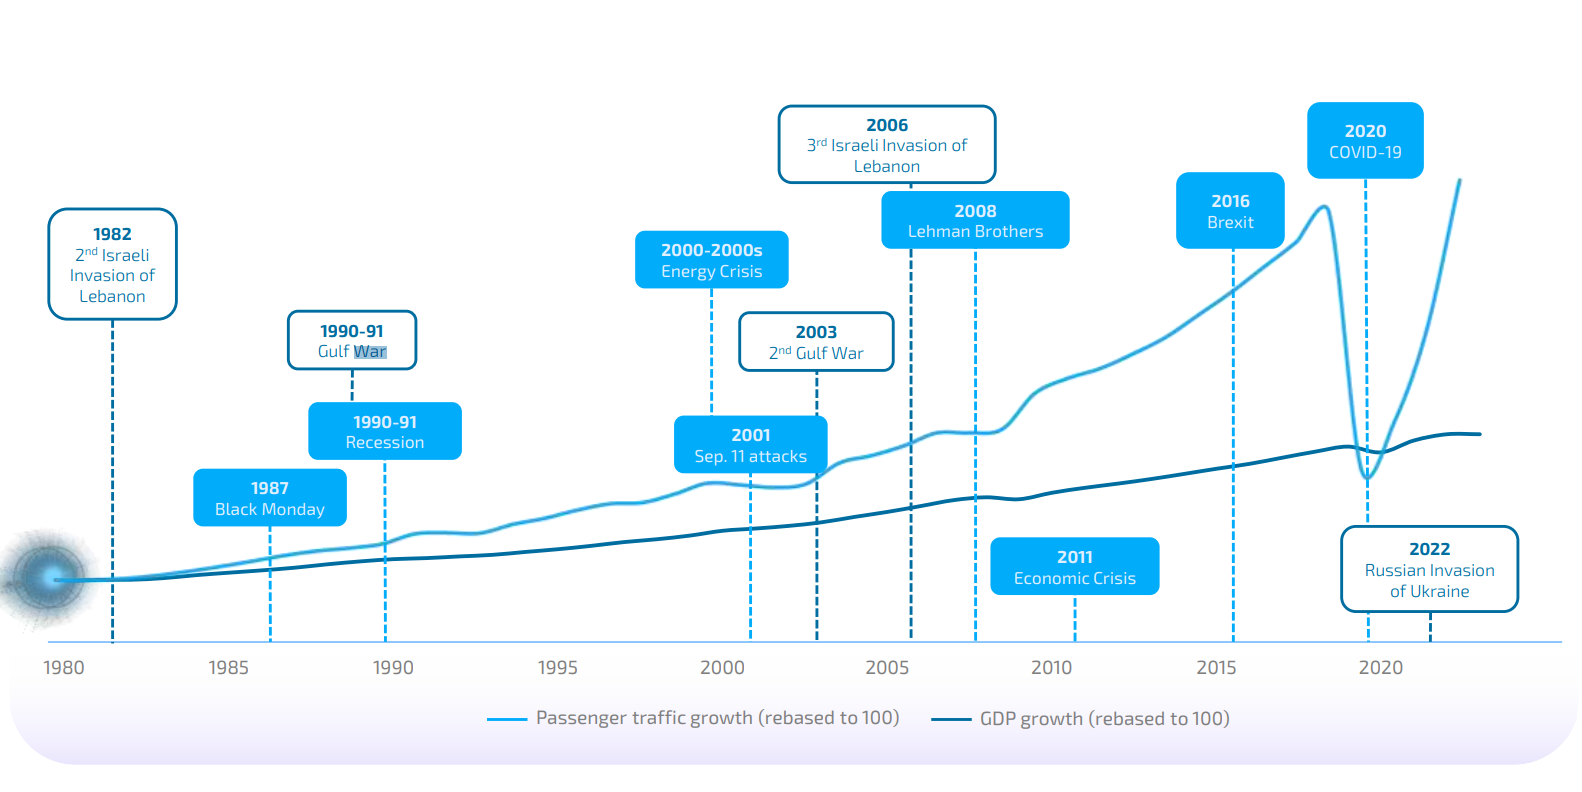
From the Las Vegas Visitor Authority: January 2025 Las Vegas Visitor Statistics Las Vegas started the year with January visitation of approx. 3.34M visitors, down 1.1% from last January. Las Vegas convention attendance reached roughly 629k in January, up 12.8% YoY, supported in part by strong attendance at recurring larger tradeshows including CES and World of Concrete, plus the calendar impact of World Market Center's Winter show (38k attendees) and Total Product Expo (8k attendees) falling fully in January this year vs. last year when its impact straddled Jan and Feb. On a room base with roughly 6k fewer rooms than last year, occupancy reached 81.9%, up 3.0 pts with Weekend occupancy of 85.6% (up 2.0 pts) and Midweek occupancy of 80.2% (up 3.2 pts.) ADR for the month reached $195 (+2.2% YoY) with RevPAR of $160 (+6.0% YoY). emphasis added Click on graph for larger image. The first graph shows visitor traffic for 2019 (Black), 2020 (dark blue), 2021 (light blue), 2022 (light orange), 2023 (orange), 2024 (dark orange) and 2025 (red). Visitor traffic was down 1.1% compared to last January. Visitor traffic was down 2.0% compared to January 2019.The second graph shows convention traffic. Convention traffic was up 12.8% compared to January 2024, and down 8.0% compared to January 2019.

From the Las Vegas Visitor Authority: January 2025 Las Vegas Visitor Statistics
Click on graph for larger image.
The first graph shows visitor traffic for 2019 (Black), 2020 (dark blue), 2021 (light blue), 2022 (light orange), 2023 (orange), 2024 (dark orange) and 2025 (red).
Visitor traffic was down 1.1% compared to last January. Visitor traffic was down 2.0% compared to January 2019.
 Convention traffic was up 12.8% compared to January 2024, and down 8.0% compared to January 2019.
Las Vegas started the year with January visitation of approx. 3.34M visitors, down 1.1% from last January.
Las Vegas convention attendance reached roughly 629k in January, up 12.8% YoY, supported in part by strong attendance at recurring larger tradeshows including CES and World of Concrete, plus the calendar impact of World Market Center's Winter show (38k attendees) and Total Product Expo (8k attendees) falling fully in January this year vs. last year when its impact straddled Jan and Feb.
On a room base with roughly 6k fewer rooms than last year, occupancy reached 81.9%, up 3.0 pts with Weekend occupancy of 85.6% (up 2.0 pts) and Midweek occupancy of 80.2% (up 3.2 pts.) ADR for the month reached $195 (+2.2% YoY) with RevPAR of $160 (+6.0% YoY).
emphasis added
 Click on graph for larger image.
 The first graph shows visitor traffic for 2019 (Black), 2020 (dark blue), 2021 (light blue), 2022 (light orange), 2023 (orange), 2024 (dark orange) and 2025 (red).
Visitor traffic was down 1.1% compared to last January. Visitor traffic was down 2.0% compared to January 2019.
The second graph shows convention traffic.