


Kubernetes Performance & Scalability: Best Practices and Optimization
Kubernetes Performance & Scalability: Best Practices and Optimization Introduction Kubernetes has revolutionized container orchestration by providing scalability, resiliency, and automation. However, as workloads grow, ensuring optimal performance and scalability becomes a challenge. This article explores best practices for scaling applications, optimizing Kubernetes Ingress controllers, monitoring and logging with Prometheus, Grafana, and Loki, and troubleshooting slow workloads. Technical Details Scaling Applications in Kubernetes Scaling in Kubernetes involves increasing or decreasing resources based on demand. There are three primary scaling techniques: Horizontal Pod Autoscaler (HPA): Adjusts the number of running pods based on CPU/memory utilization or custom metrics. Vertical Pod Autoscaler (VPA): Dynamically adjusts resource requests and limits for individual pods. Cluster Autoscaler: Scales the number of worker nodes based on pending pod requirements. These scaling methods ensure efficient resource utilization and cost-effectiveness. Efficient Use of Kubernetes Ingress Controllers Kubernetes Ingress Controllers manage external access to services within the cluster. Best practices include: Choosing the right controller (NGINX, Traefik, HAProxy, etc.) based on requirements. Implementing rate limiting and caching to optimize performance. Using TLS termination for secure connections. Configuring session persistence for consistent user experience. Monitoring and Logging with Prometheus, Grafana, and Loki Prometheus: Captures time-series data for CPU, memory, and network metrics. Grafana: Visualizes metrics and provides alerting capabilities. Loki: Collects and indexes logs without requiring full-text search. Integration of these tools provides deep observability into the cluster’s health and performance. Troubleshooting Slow Kubernetes Workloads Common reasons for slow workloads include: High resource contention: Insufficient CPU/memory limits. Networking issues: Suboptimal pod-to-pod communication. Misconfigured storage: Latency in persistent volume claims. CrashLoopBackOff errors: Application failures causing pod restarts. Tools like kubectl top, kubectl describe, and Prometheus alerts help diagnose and resolve these issues. Real-Time Scenario Imagine Kubernetes as a smart traffic management system in a city. Just like roads handle traffic, Kubernetes nodes manage workloads. Scaling acts like dynamic lane allocation, Ingress controllers function as traffic signals, and monitoring tools resemble real-time traffic cameras. For instance, if a surge in traffic (user requests) occurs, HPA increases the number of cars (pods) on the road (cluster). If certain intersections (Ingress points) become congested, load balancers optimize the flow. Traffic cameras (Prometheus/Grafana) continuously analyze road conditions to prevent bottlenecks. Benefits and Best Practices Benefits Improved application performance and availability. Optimized resource utilization and cost efficiency. Faster issue resolution with real-time monitoring. Best Practices Use resource requests and limits to prevent noisy neighbor issues. Enable auto-scaling to dynamically adjust resources. Implement efficient logging and alerting to detect anomalies early. Regularly benchmark and optimize networking settings. Implementation Walkthrough Step 1: Implement HPA for an Application apiVersion: autoscaling/v2 kind: HorizontalPodAutoscaler metadata: name: my-app-hpa spec: scaleTargetRef: apiVersion: apps/v1 kind: Deployment name: my-app minReplicas: 2 maxReplicas: 10 metrics: - type: Resource resource: name: cpu target: type: Utilization averageUtilization: 70 Step 2: Configure Prometheus and Grafana for Monitoring apiVersion: monitoring.coreos.com/v1 kind: ServiceMonitor metadata: name: my-app-monitor spec: selector: matchLabels: app: my-app endpoints: - port: http path: /metrics Step 3: Optimize Kubernetes Ingress Controller (NGINX Example) apiVersion: networking.k8s.io/v1 kind: Ingress metadata: name: my-app-ingress annotations: nginx.ingress.kubernetes.io/rewrite-target: / spec: rules: - host: myapp.example.com http: paths: - path: / pathType: Prefix backend: service: name: my-app port: number: 80 Challenges and Considerations HPA tuning requires careful metric selection to avoid over-scaling. Ingress controllers introduce additional latency if misconfigured. Log aggregation may cause performance bottlenecks if not optimized. Future Trends AI-driven Kubernetes scaling to predict and optimize resource allocation. Improved multi-cluster federation for seamless scalability across cloud providers. Serverless Kubernetes (Knative) for auto-scaling workloads without managing infrastructure. Kubernetes #DevOp
Kubernetes Performance & Scalability: Best Practices and Optimization
Introduction
Kubernetes has revolutionized container orchestration by providing scalability, resiliency, and automation. However, as workloads grow, ensuring optimal performance and scalability becomes a challenge. This article explores best practices for scaling applications, optimizing Kubernetes Ingress controllers, monitoring and logging with Prometheus, Grafana, and Loki, and troubleshooting slow workloads.
Technical Details
Scaling Applications in Kubernetes
Scaling in Kubernetes involves increasing or decreasing resources based on demand. There are three primary scaling techniques:
- Horizontal Pod Autoscaler (HPA): Adjusts the number of running pods based on CPU/memory utilization or custom metrics.
- Vertical Pod Autoscaler (VPA): Dynamically adjusts resource requests and limits for individual pods.
- Cluster Autoscaler: Scales the number of worker nodes based on pending pod requirements.
These scaling methods ensure efficient resource utilization and cost-effectiveness.
Efficient Use of Kubernetes Ingress Controllers
Kubernetes Ingress Controllers manage external access to services within the cluster. Best practices include:
- Choosing the right controller (NGINX, Traefik, HAProxy, etc.) based on requirements.
- Implementing rate limiting and caching to optimize performance.
- Using TLS termination for secure connections.
- Configuring session persistence for consistent user experience.
Monitoring and Logging with Prometheus, Grafana, and Loki
- Prometheus: Captures time-series data for CPU, memory, and network metrics.
- Grafana: Visualizes metrics and provides alerting capabilities.
- Loki: Collects and indexes logs without requiring full-text search.
Integration of these tools provides deep observability into the cluster’s health and performance.
Troubleshooting Slow Kubernetes Workloads
Common reasons for slow workloads include:
- High resource contention: Insufficient CPU/memory limits.
- Networking issues: Suboptimal pod-to-pod communication.
- Misconfigured storage: Latency in persistent volume claims.
- CrashLoopBackOff errors: Application failures causing pod restarts.
Tools like kubectl top, kubectl describe, and Prometheus alerts help diagnose and resolve these issues.
Real-Time Scenario
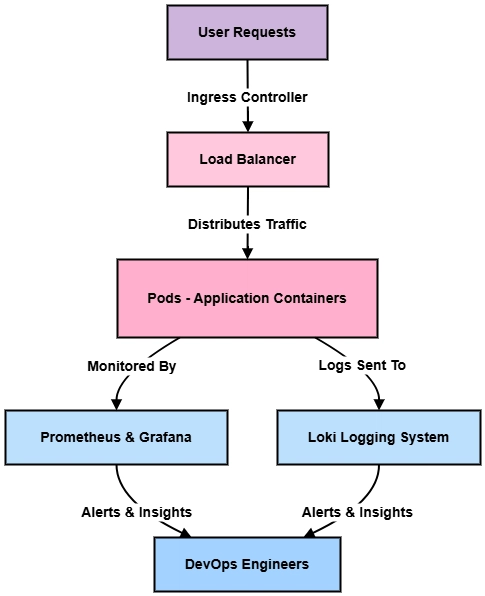
Imagine Kubernetes as a smart traffic management system in a city. Just like roads handle traffic, Kubernetes nodes manage workloads. Scaling acts like dynamic lane allocation, Ingress controllers function as traffic signals, and monitoring tools resemble real-time traffic cameras.
For instance, if a surge in traffic (user requests) occurs, HPA increases the number of cars (pods) on the road (cluster). If certain intersections (Ingress points) become congested, load balancers optimize the flow. Traffic cameras (Prometheus/Grafana) continuously analyze road conditions to prevent bottlenecks.
Benefits and Best Practices
Benefits
- Improved application performance and availability.
- Optimized resource utilization and cost efficiency.
- Faster issue resolution with real-time monitoring.
Best Practices
- Use resource requests and limits to prevent noisy neighbor issues.
- Enable auto-scaling to dynamically adjust resources.
- Implement efficient logging and alerting to detect anomalies early.
- Regularly benchmark and optimize networking settings.
Implementation Walkthrough
Step 1: Implement HPA for an Application
apiVersion: autoscaling/v2
kind: HorizontalPodAutoscaler
metadata:
  name: my-app-hpa
spec:
  scaleTargetRef:
    apiVersion: apps/v1
    kind: Deployment
    name: my-app
  minReplicas: 2
  maxReplicas: 10
  metrics:
  - type: Resource
    resource:
      name: cpu
      target:
        type: Utilization
        averageUtilization: 70
Step 2: Configure Prometheus and Grafana for Monitoring
apiVersion: monitoring.coreos.com/v1
kind: ServiceMonitor
metadata:
  name: my-app-monitor
spec:
  selector:
    matchLabels:
      app: my-app
  endpoints:
  - port: http
    path: /metrics
Step 3: Optimize Kubernetes Ingress Controller (NGINX Example)
apiVersion: networking.k8s.io/v1
kind: Ingress
metadata:
  name: my-app-ingress
  annotations:
    nginx.ingress.kubernetes.io/rewrite-target: /
spec:
  rules:
  - host: myapp.example.com
    http:
      paths:
      - path: /
        pathType: Prefix
        backend:
          service:
            name: my-app
            port:
              number: 80
Challenges and Considerations
- HPA tuning requires careful metric selection to avoid over-scaling.
- Ingress controllers introduce additional latency if misconfigured.
- Log aggregation may cause performance bottlenecks if not optimized.
Future Trends
- AI-driven Kubernetes scaling to predict and optimize resource allocation.
- Improved multi-cluster federation for seamless scalability across cloud providers.
- Serverless Kubernetes (Knative) for auto-scaling workloads without managing infrastructure.