


How to debug AI generated code?
Watch super short demo gif If you're using AI to generate code, you've probably experienced this: the AI spits out a bunch of code that looks reasonable, but when you run it... nothing works. And then begins the tedious process of figuring out why. The Problem with Debugging AI Code When I first started working with AI-generated code, I found debugging to be incredibly frustrating. The AI would write complex functions that looked correct, but tracing through execution was a nightmare. I'll usually have not even the beginning of an idea of where to start debugging. That's why I'd end up with console logs everywhere. The worst part? When you go back to the AI with the error message, it just guesses what might be wrong without knowing what actually happened during runtime. A Better Way to Debug This is actually why I built Ariana. I got so tired of this exact problem that I wanted something that would just show me everything happening at runtime without requiring me to modify the code. In the cover gif, you can see how I debug an AI-generated fullstack app. API calls keep failing. Instead of sprinkling console.log() statements everywhere in backend and frontend to figure it out, I just: Run the backend and frontend with ariana npm run dev Click through the execution traces in the side panel Notice the red highlighted code (showing where errors happened) Hover over the OPENROUTER_API_KEY variable to see it's still set to "placeholder" Found the bug in seconds, not hours, and didn't have to modify a single line of code or use a regular debugger (considering I'd have no idea instinctively where to start debugging since it's not "my" code). Getting Started Ariana is still experimental, but it's free and works with JavaScript/TypeScript and Python codebases. Here's how to try it: Install the extension for VSCode, Cursor, or Windsurf Install the CLI: npm install -g ariana or pip install ariana Run your code with: ariana npm run dev or ariana python app.py That's it. Now you can see what values every expression had during execution by hovering over them in your code editor. Why This Matters When debugging code generated by the AI, you need to understand what's actually happening inside the program, not just what the code looks like. Having runtime visibility without putting Console.log/print or breakpoints and following them all by hand, makes all the difference. You can check out more info at ariana.dev. I'm actively improving it, so expect some rough edges, but I'd love to hear if it helps you debug AI-generated code more easily. What's your biggest pain point with debugging (AI-generated) code? Let me know in the comments!
If you're using AI to generate code, you've probably experienced this: the AI spits out a bunch of code that looks reasonable, but when you run it... nothing works.
And then begins the tedious process of figuring out why.
The Problem with Debugging AI Code
When I first started working with AI-generated code, I found debugging to be incredibly frustrating. The AI would write complex functions that looked correct, but tracing through execution was a nightmare.
I'll usually have not even the beginning of an idea of where to start debugging. That's why I'd end up with console logs everywhere.
The worst part? When you go back to the AI with the error message, it just guesses what might be wrong without knowing what actually happened during runtime.
A Better Way to Debug
This is actually why I built Ariana. I got so tired of this exact problem that I wanted something that would just show me everything happening at runtime without requiring me to modify the code.
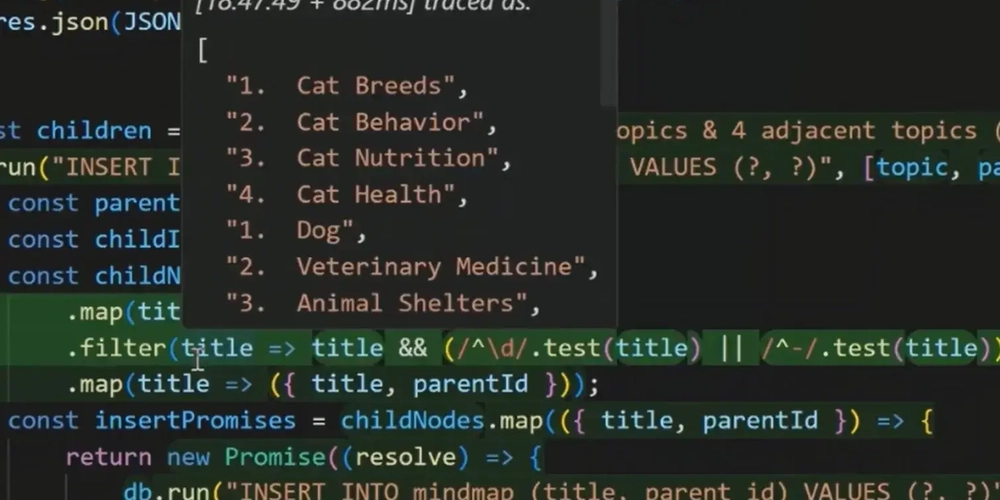
In the cover gif, you can see how I debug an AI-generated fullstack app. API calls keep failing. Instead of sprinkling console.log() statements everywhere in backend and frontend to figure it out, I just:
- Run the backend and frontend with
ariana npm run dev - Click through the execution traces in the side panel
- Notice the red highlighted code (showing where errors happened)
- Hover over the
OPENROUTER_API_KEYvariable to see it's still set to "placeholder"
Found the bug in seconds, not hours, and didn't have to modify a single line of code or use a regular debugger (considering I'd have no idea instinctively where to start debugging since it's not "my" code).
Getting Started
Ariana is still experimental, but it's free and works with JavaScript/TypeScript and Python codebases. Here's how to try it:
- Install the extension for VSCode, Cursor, or Windsurf
- Install the CLI:
npm install -g arianaorpip install ariana - Run your code with:
ariana npm run devorariana python app.py
That's it. Now you can see what values every expression had during execution by hovering over them in your code editor.
Why This Matters
When debugging code generated by the AI, you need to understand what's actually happening inside the program, not just what the code looks like. Having runtime visibility without putting Console.log/print or breakpoints and following them all by hand, makes all the difference.
You can check out more info at ariana.dev. I'm actively improving it, so expect some rough edges, but I'd love to hear if it helps you debug AI-generated code more easily.
What's your biggest pain point with debugging (AI-generated) code? Let me know in the comments!


