


How to build Dashboards from MySQL data
MySQL is the most popular open-source relational database management system (RDBMS) that simplifies data management with structured tables, relationships. Key features of MySQL are: Uses structured tables to store and manage data. Open source. Handles large databases with support for indexing, partitioning, and replication. Cross-platform compatibility. Supports standard SQL syntax for queries and data manipulation. JSON support. Using Draxlr to build Dashboards from MySQL data Draxlr is a self-serve BI solution for dashboards, automated data change alerts, and embedded analytics on customer-facing platforms. Here is a quick video walkthrough of how to build a dashboard from MySQL data in Draxlr: Ok, let's get started. Connecting MySQL with Draxlr Login into Draxlr and navigate to the Add Database page. Select MySQL from the available database options. Add the MySQL database credentials into respective fields. Once the correct details are added, Draxlr syncs the data and helps you create a chart by selecting a table and defining the x-axis and y-axis values. Once the table and axes are selected, Draxlr generates the first saved query, adds it to the dashboard, and sets an alert as a part of smooth onboarding. How to build queries and dashboard from MySQL data? Building a query is the first step in creating dashboards, setting alerts, and embedding insights. Draxlr offers three ways to generate queries from MySQL data: Query Builder – A no-code simple interface for defining queries using point-and-click actions. Raw SQL – A SQL editor for writing complex and custom queries manually. AI-powered SQL Generation – A natural language interface that translates English inputs into corresponding SQL queries. Example: Query Builder Let's consider an example to find the number of products in each category, Let's build the above query with Draxlr's no-code query builder Choose Categories as the table. Apply a LEFT JOIN with the Products table. Group by Category Name. Functions products count. Click Execute, and you’re done! You can now visualize this data with various chart options, including bar, pie, tree map, and more and also modify them with various customization options. Once the query is saved with the desired visualization, you can add it to the dashboard and set-up data change notifications on Slack and/or email. And your dashboard is ready! You can make the dashboard accessible to your team and embed it into your customer-facing app.
MySQL is the most popular open-source relational database management system (RDBMS) that simplifies data management with structured tables, relationships.
Key features of MySQL are:
- Uses structured tables to store and manage data.
- Open source.
- Handles large databases with support for indexing, partitioning, and replication.
- Cross-platform compatibility.
- Supports standard SQL syntax for queries and data manipulation.
- JSON support.
Using Draxlr to build Dashboards from MySQL data
Draxlr is a self-serve BI solution for dashboards, automated data change alerts, and embedded analytics on customer-facing platforms.
Here is a quick video walkthrough of how to build a dashboard from MySQL data in Draxlr:
Ok, let's get started.
Connecting MySQL with Draxlr
- Login into Draxlr and navigate to the Add Database page.
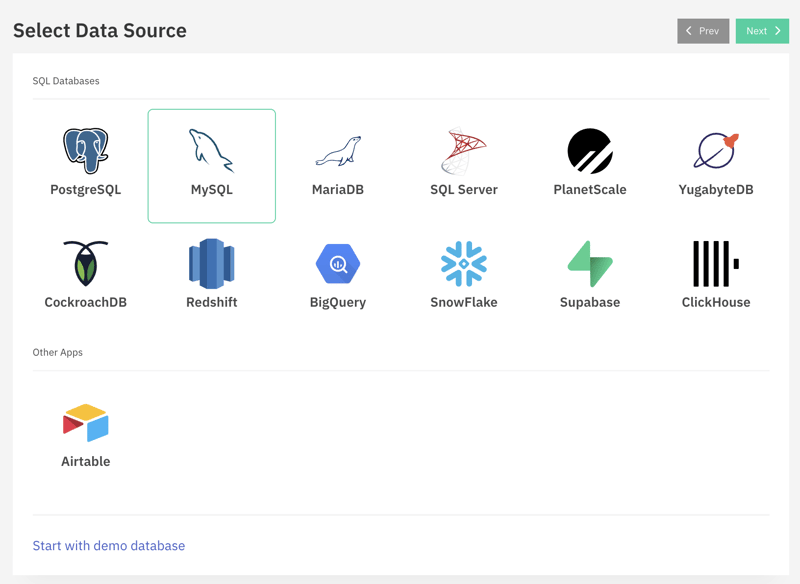
- Select MySQL from the available database options.
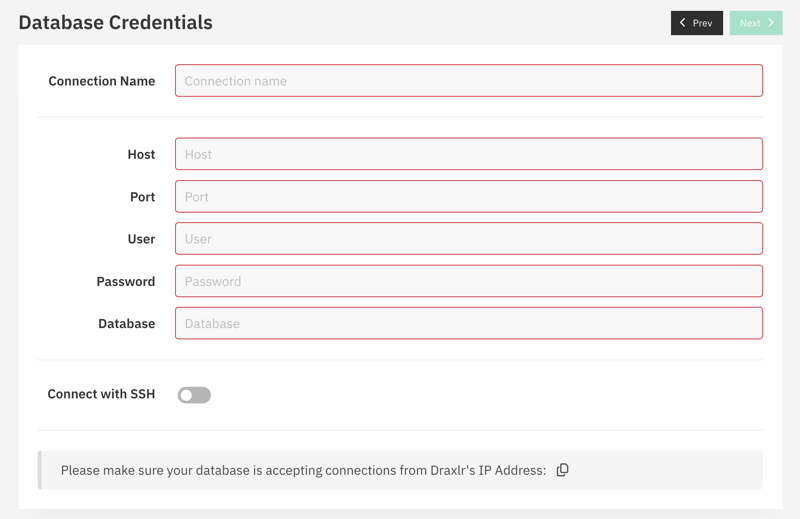
- Add the MySQL database credentials into respective fields.
- Once the correct details are added, Draxlr syncs the data and helps you create a chart by selecting a table and defining the x-axis and y-axis values.
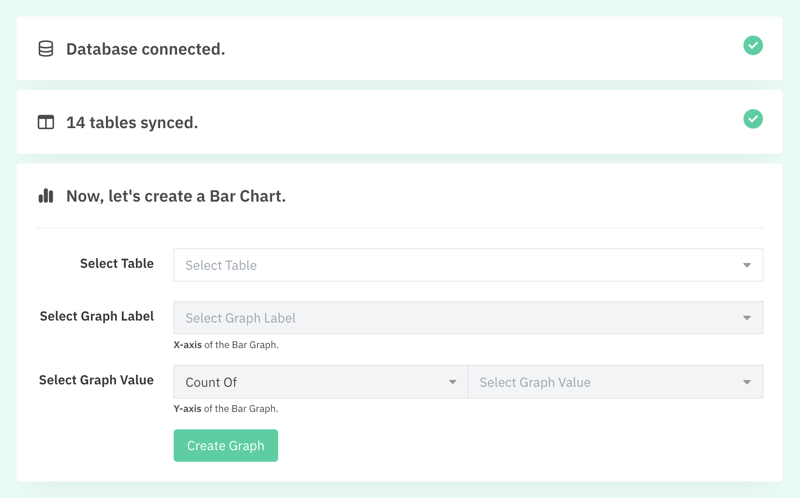
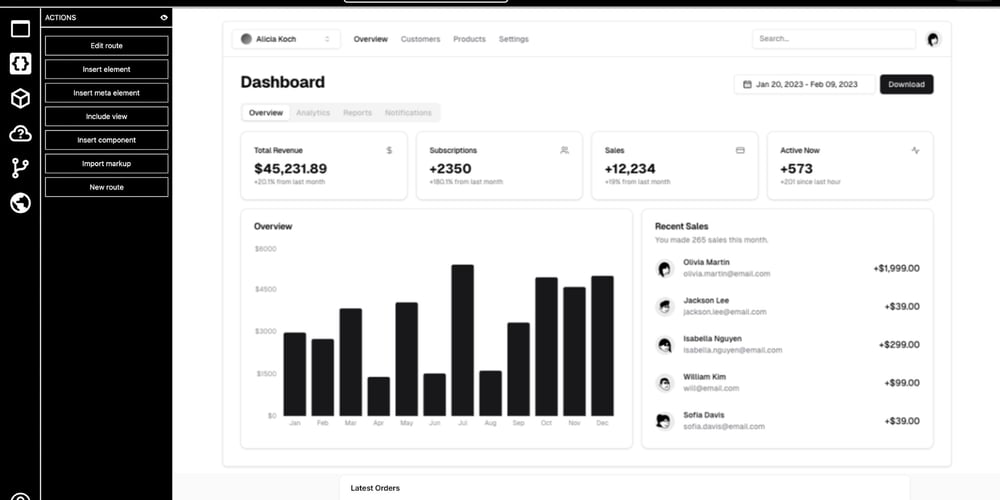
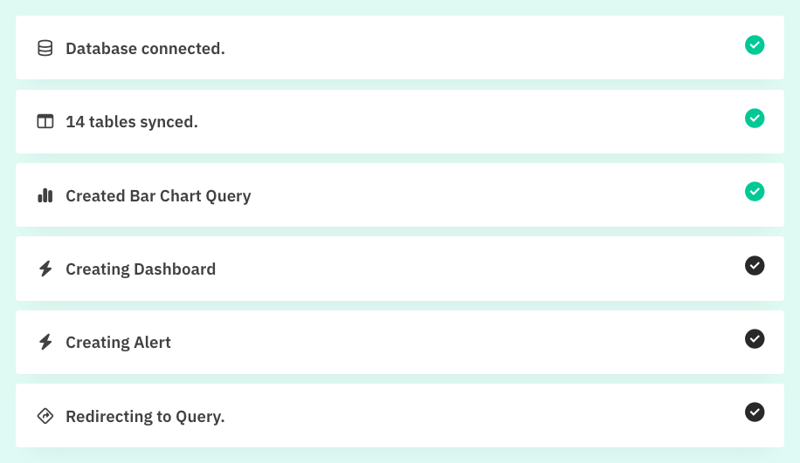
- Once the table and axes are selected, Draxlr generates the first saved query, adds it to the dashboard, and sets an alert as a part of smooth onboarding.
How to build queries and dashboard from MySQL data?
Building a query is the first step in creating dashboards, setting alerts, and embedding insights. Draxlr offers three ways to generate queries from MySQL data:
- Query Builder – A no-code simple interface for defining queries using point-and-click actions.
- Raw SQL – A SQL editor for writing complex and custom queries manually.
- AI-powered SQL Generation – A natural language interface that translates English inputs into corresponding SQL queries.
Example: Query Builder
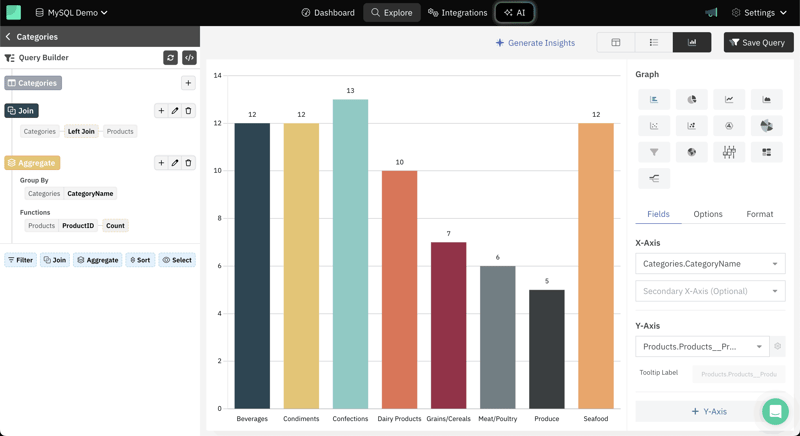
Let's consider an example to find the number of products in each category,
- Let's build the above query with Draxlr's no-code query builder
- Choose Categories as the table.
- Apply a LEFT JOIN with the Products table.
- Group by Category Name.
- Functions products count.
- Click Execute, and you’re done!
You can now visualize this data with various chart options, including bar, pie, tree map, and more and also modify them with various customization options.
Once the query is saved with the desired visualization, you can add it to the dashboard and set-up data change notifications on Slack and/or email.
And your dashboard is ready!
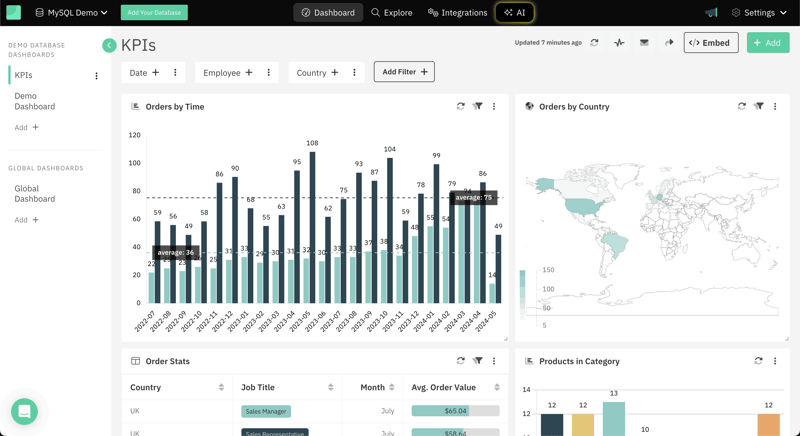
You can make the dashboard accessible to your team and embed it into your customer-facing app.