Debug Like a Pro: Why JavaScript Developers Should Move Beyond console.log()
Say No to Console.log! Better Debugging in JavaScript Are you still littering your code with console.log() statements? While this tried-and-true debugging method has served developers for years, it's time to level up your debugging arsenal with more powerful alternatives that JavaScript offers. The Problem with console.log function processData(data) { console.log("data received:", data); // More processing console.log("after transformation:", data); // Even more processing console.log("final result:", data); return data; } We've all been there—sprinkling console.log() statements throughout our code, then manually scanning through a cluttered console trying to make sense of the output. This approach: Creates console noise Requires manual cleanup afterward Provides limited context about your data Becomes unwieldy with complex objects Better Alternatives 1. console.table() Perfect for array and object data: const users = [ { name: "Alice", age: 25, role: "Developer" }, { name: "Bob", age: 32, role: "Designer" }, { name: "Charlie", age: 28, role: "Manager" } ]; console.table(users); This displays your data in a clean, sortable table format. Learn more about console.table() on MDN 2. console.group() Group related logs together: console.group("User Authentication Process"); console.log("Validating user input..."); console.log("Checking credentials..."); console.log("Authorization successful!"); console.groupEnd(); Explore more console methods on MDN 3. Conditional Breakpoints In your browser's developer tools, right-click a line number and set a conditional breakpoint: // Break only when id === 42 if (user.id === 42) { // Execution will pause here when condition is met } Learn about Chrome DevTools breakpoints 4. debugger Statement Add an explicit breakpoint in your code: function calculateTotal(items) { let sum = 0; for (const item of items) { debugger; // Execution pauses here when DevTools is open sum += item.price * item.quantity; } return sum; } Understand the debugger statement on MDN 5. console.assert() Test expectations without disrupting execution: function withdraw(account, amount) { console.assert(account.balance >= amount, "Insufficient funds", {account, amount}); // Function continues regardless of assertion result } Dive into console.assert() on MDN When to Use What Inspecting complex data: console.table(), console.dir() Tracking flow and timing: console.group(), console.time() Investigating specific conditions: Conditional breakpoints Deep debugging: debugger statement Validating assumptions: console.assert() By expanding your debugging toolkit beyond basic console.log() statements, you'll solve problems faster and write cleaner code. Your future self (and teammates) will thank you! Additional Resources Chrome DevTools Documentation Firefox Developer Tools JavaScript Debugging for Beginners JavaScript Debugging Patterns
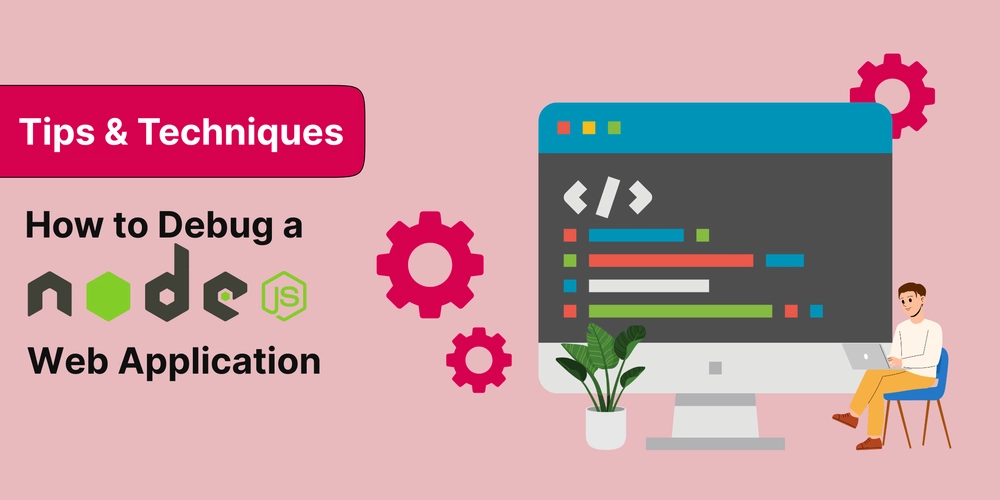
Say No to Console.log! Better Debugging in JavaScript
Are you still littering your code with console.log() statements? While this tried-and-true debugging method has served developers for years, it's time to level up your debugging arsenal with more powerful alternatives that JavaScript offers.
The Problem with console.log
function processData(data) {
  console.log("data received:", data);
  // More processing
  console.log("after transformation:", data);
  // Even more processing
  console.log("final result:", data);
  return data;
}
We've all been there—sprinkling console.log() statements throughout our code, then manually scanning through a cluttered console trying to make sense of the output. This approach:
- Creates console noise
- Requires manual cleanup afterward
- Provides limited context about your data
- Becomes unwieldy with complex objects
Better Alternatives
1. console.table()
Perfect for array and object data:
const users = [
  { name: "Alice", age: 25, role: "Developer" },
  { name: "Bob", age: 32, role: "Designer" },
  { name: "Charlie", age: 28, role: "Manager" }
];

console.table(users);
This displays your data in a clean, sortable table format.
Learn more about console.table() on MDN
2. console.group()
Group related logs together:
console.group("User Authentication Process");
console.log("Validating user input...");
console.log("Checking credentials...");
console.log("Authorization successful!");
console.groupEnd();
Explore more console methods on MDN
3. Conditional Breakpoints
In your browser's developer tools, right-click a line number and set a conditional breakpoint:
// Break only when id === 42
if (user.id === 42) {
  // Execution will pause here when condition is met
}
Learn about Chrome DevTools breakpoints
4. debugger Statement
Add an explicit breakpoint in your code:
function calculateTotal(items) {
  let sum = 0;
  for (const item of items) {
    debugger; // Execution pauses here when DevTools is open
    sum += item.price * item.quantity;
  }
  return sum;
}
Understand the debugger statement on MDN
5. console.assert()
Test expectations without disrupting execution:
function withdraw(account, amount) {
  console.assert(account.balance >= amount,
    "Insufficient funds", {account, amount});
  // Function continues regardless of assertion result
}
Dive into console.assert() on MDN
When to Use What
-
Inspecting complex data:
console.table(),console.dir() -
Tracking flow and timing:
console.group(),console.time() - Investigating specific conditions: Conditional breakpoints
-
Deep debugging:
debuggerstatement -
Validating assumptions:
console.assert()
By expanding your debugging toolkit beyond basic console.log() statements, you'll solve problems faster and write cleaner code. Your future self (and teammates) will thank you!


