


Coroot – eBPF-based, open source observability with actionable insights
A common open source approach to observability will begin with databases and visualizations for telemetry - Grafana, Prometheus, Jaeger. But observability doesn’t begin and end here: these tools require configuration, dashboard customization, and may not actually pinpoint the data you need to mitigate system risks. Coroot was designed to solve the problem of manual, time-consuming observability analysis: it handles the full observability journey — from collecting telemetry to turning it into actionable insights. We also strongly believe that simple observability should be an innovation everyone can benefit from: which is why our software is open source. Features: Cost monitoring to track and minimise your cloud expenses (AWS, GCP, Azure.) SLO tracking with alerts to detect anomalies and compare them to your system’s baseline behaviour. 1-click application profiling: see the exact line of code that caused an anomaly. Mapped timeframes (stop digging through Grafana to find when the incident occurred.) eBPF automatically gathers logs, metrics, traces, and profiles for you. Service map to grasp a complete at-a-glance picture of your system. Automatic discovery and monitoring of every application deployment in your kubernetes cluster. You can view Coroot’s documentation here, visit our Github, and join our Slack to become part of our community. We welcome any feedback and hope the tool can improve your workflow!
A common open source approach to observability will begin with databases and visualizations for telemetry - Grafana, Prometheus, Jaeger. But observability doesn’t begin and end here: these tools require configuration, dashboard customization, and may not actually pinpoint the data you need to mitigate system risks.
Coroot was designed to solve the problem of manual, time-consuming observability analysis: it handles the full observability journey — from collecting telemetry to turning it into actionable insights. We also strongly believe that simple observability should be an innovation everyone can benefit from: which is why our software is open source.
Cost monitoring to track and minimise your cloud expenses (AWS, GCP, Azure.)
SLO tracking with alerts to detect anomalies and compare them to your system’s baseline behaviour.
1-click application profiling: see the exact line of code that caused an anomaly.
Mapped timeframes (stop digging through Grafana to find when the incident occurred.)
eBPF automatically gathers logs, metrics, traces, and profiles for you.
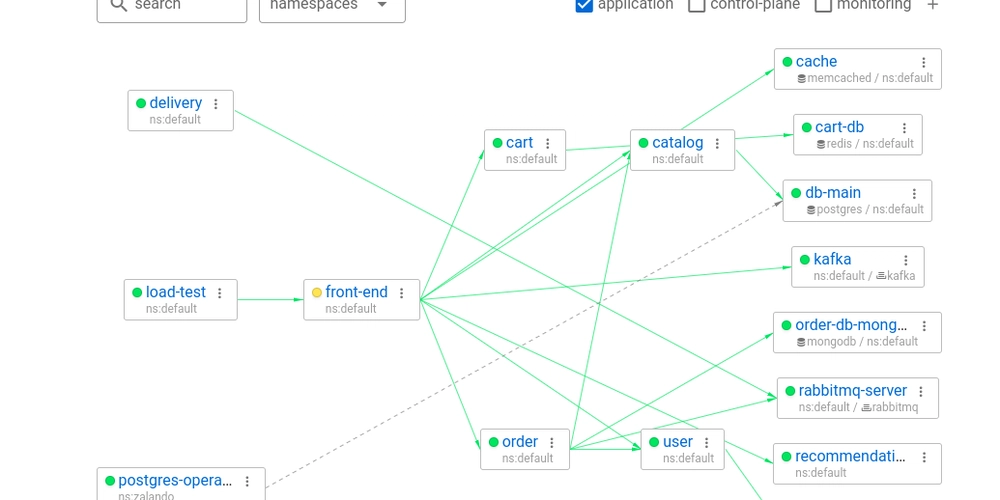
Service map to grasp a complete at-a-glance picture of your system.
Automatic discovery and monitoring of every application deployment in your kubernetes cluster.
You can view Coroot’s documentation here, visit our Github, and join our Slack to become part of our community. We welcome any feedback and hope the tool can improve your workflow!


