


Calculate the DORA Lead Time Metric in Python
DORA (DevOps Research and Assessment) metrics have become the gold standard for measuring software delivery performance. Among these metrics, Lead Time for Changes is a good indicator of your team's efficiency to deliver changes in production. Let us understand what this metric is, why it matters, and how you can calculate it using Jira and GitHub data with Python code. What is the DORA Lead Time Metric? Lead Time for Changes measures the duration from when code is first committed until it is successfully deployed to production. In simpler terms, it answers the question: "How long does it take for a code change to go from a developer's machine to serving users in production?" According to DORA research, organizations typically fall into these performance categories: Elite performers: Less than one hour High performers: Between one day and one week Medium performers: Between one week and one month Low performers: Between one month and six months A shorter lead time indicates: Faster delivery of features to users Quicker bug fixes and security patches More agile response to changing requirements Less work-in-progress building up Reduced context switching for developers So, lead time is a powerful indicator of your development process efficiency. Long lead times often signal bottlenecks in your development pipeline that need addressing. Calculating Lead Time If you use Jira and GitHub, you can calculate lead time by connecting data from both platforms. The calculation involves several steps: Projects → Releases → Stories → Pull Requests → Commits Projects: First, gather all software projects from Jira Releases: For each project, collect released versions within a specified date range Stories: Identify all Jira stories associated with each release Pull Requests: For each story, find the linked GitHub pull requests Commits: Within each pull request, analyze all commits For each pull request, lead time is calculated as: lead_time = release_date - earliest_commit_date + 1 The key here is using the earliest commit date rather than the pull request creation date. This captures the true beginning of work, even if the pull request was created later. The final DORA lead time metric is calculated by averaging all individual lead times over a specified time period, for a given set of projects. Manage This in Jira and GitHub To effectively use this approach, you need to understand how to manage the key components in Jira. Create Jira releases (or "versions") for each planned release, and set release dates when versions are published. Mark versions as "Released" once deployed. Assign the release to a project. In this context projects typically represent teams, products, or components. Stories are work items (features, bugs, etc.) included in releases. Use the Jira GitHub integration to connect your repositories. Reference Jira issues in pull request titles or descriptions** (e.g., "PROJ-123: Add new feature"). Use smart commits in your commit messages. Using Python to Generate lead Time Reports The dora-lead-time package provides a simple way to calculate and visualize lead time metrics. It connects to your Jira and GitHub data, calculates lead times, and generates reports. Here is how you might use the package to generate a monthly lead time report: First set up your tokens to access Jira and GitHub. Set the following environmental variables. Create ATLASSIAN_TOKEN containing the API token for Atlassian Jira access. Create JIRA_INSTANCE for your Jira instance URL (e.g., company.atlassian.net) Create EMAIL for your Atlassian account email address. Create personal access tokens for each GitHub organization, for example, GITHUB_TOKEN_ORG1, GITHUB_TOKEN_ORG2, etc. to authenticate API requests to specific GitHub organizations. Each organization you need to access requires its own token. Create an environmental variable GITHUB_ORG_TOKENS_MAP which is a JSON string mapping organization names to environment variable names. For example: GITHUB_ORG_TOKENS_MAP={"Org1": "GITHUB_TOKEN_ORG1", "Org2": "GITHUB_TOKEN_ORG2"} You can optionally set SQLITE_PATH which is the path where the SQLite database will be created. START_DATE and END_DATE to define the date range for which to calculate lead time metrics, using ISO date strings (YYYY-MM-DD). Here is a complete examples which you can put in a ".env" file: GITHUB_TOKEN_ORG1=your_personal_access_token_for_org1 GITHUB_TOKEN_ORG2=your_personal_access_token_for_org2 GITHUB_ORG_TOKENS_MAP={"Org1": "GITHUB_TOKEN_ORG1", "Org2": "GITHUB_TOKEN_ORG2"} ATLASSIAN_TOKEN=your_atlassian_api_token JIRA_INSTANCE=your_company.atlassian.net EMAIL=your_email@your_company.com SQLITE_PATH=./releases.db START_DATE=2023-01-01 END_DATE=2023-12-31 Then run code similar to the following to generate a lead time report: from datetime import date from dora_lead_time.lead_time_report import LeadTimeReport # Initiali
DORA (DevOps Research and Assessment) metrics have become the gold standard for measuring software delivery performance. Among these metrics, Lead Time for Changes is a good indicator of your team's efficiency to deliver changes in production. Let us understand what this metric is, why it matters, and how you can calculate it using Jira and GitHub data with Python code.
What is the DORA Lead Time Metric?
Lead Time for Changes measures the duration from when code is first committed until it is successfully deployed to production. In simpler terms, it answers the question: "How long does it take for a code change to go from a developer's machine to serving users in production?"
According to DORA research, organizations typically fall into these performance categories:
- Elite performers: Less than one hour
- High performers: Between one day and one week
- Medium performers: Between one week and one month
- Low performers: Between one month and six months
A shorter lead time indicates:
- Faster delivery of features to users
- Quicker bug fixes and security patches
- More agile response to changing requirements
- Less work-in-progress building up
- Reduced context switching for developers
So, lead time is a powerful indicator of your development process efficiency. Long lead times often signal bottlenecks in your development pipeline that need addressing.
Calculating Lead Time
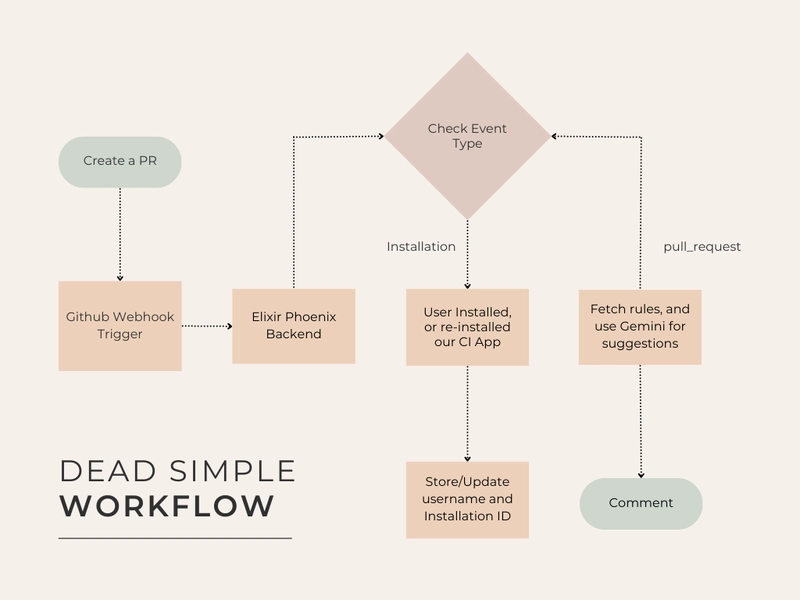
If you use Jira and GitHub, you can calculate lead time by connecting data from both platforms. The calculation involves several steps:
Projects → Releases → Stories → Pull Requests → Commits
- Projects: First, gather all software projects from Jira
- Releases: For each project, collect released versions within a specified date range
- Stories: Identify all Jira stories associated with each release
- Pull Requests: For each story, find the linked GitHub pull requests
- Commits: Within each pull request, analyze all commits
For each pull request, lead time is calculated as:
lead_time = release_date - earliest_commit_date + 1
The key here is using the earliest commit date rather than the pull request creation date. This captures the true beginning of work, even if the pull request was created later. The final DORA lead time metric is calculated by averaging all individual lead times over a specified time period, for a given set of projects.
Manage This in Jira and GitHub
To effectively use this approach, you need to understand how to manage the key components in Jira. Create Jira releases (or "versions") for each planned release, and set release dates when versions are published. Mark versions as "Released" once deployed. Assign the release to a project. In this context projects typically represent teams, products, or components. Stories are work items (features, bugs, etc.) included in releases. Use the Jira GitHub integration to connect your repositories. Reference Jira issues in pull request titles or descriptions** (e.g., "PROJ-123: Add new feature"). Use smart commits in your commit messages.
Using Python to Generate lead Time Reports
The dora-lead-time package provides a simple way to calculate and visualize lead time metrics. It connects to your Jira and GitHub data, calculates lead times, and generates reports. Here is how you might use the package to generate a monthly lead time report:
First set up your tokens to access Jira and GitHub. Set the following environmental variables.
- Create
ATLASSIAN_TOKENcontaining the API token for Atlassian Jira access. - Create
JIRA_INSTANCEfor your Jira instance URL (e.g.,company.atlassian.net) - Create
EMAILfor your Atlassian account email address. - Create personal access tokens for each GitHub organization, for example,
GITHUB_TOKEN_ORG1,GITHUB_TOKEN_ORG2, etc. to authenticate API requests to specific GitHub organizations. Each organization you need to access requires its own token. - Create an environmental variable
GITHUB_ORG_TOKENS_MAPwhich is a JSON string mapping organization names to environment variable names. For example:GITHUB_ORG_TOKENS_MAP={"Org1": "GITHUB_TOKEN_ORG1", "Org2": "GITHUB_TOKEN_ORG2"}
You can optionally set
-
SQLITE_PATHwhich is the path where the SQLite database will be created. -
START_DATEandEND_DATEto define the date range for which to calculate lead time metrics, using ISO date strings (YYYY-MM-DD).
Here is a complete examples which you can put in a ".env" file:
GITHUB_TOKEN_ORG1=your_personal_access_token_for_org1
GITHUB_TOKEN_ORG2=your_personal_access_token_for_org2
GITHUB_ORG_TOKENS_MAP={"Org1": "GITHUB_TOKEN_ORG1", "Org2": "GITHUB_TOKEN_ORG2"}
ATLASSIAN_TOKEN=your_atlassian_api_token
JIRA_INSTANCE=your_company.atlassian.net
EMAIL=your_email@your_company.com
SQLITE_PATH=./releases.db
START_DATE=2023-01-01
END_DATE=2023-12-31
Then run code similar to the following to generate a lead time report:
from datetime import date
from dora_lead_time.lead_time_report import LeadTimeReport

# Initialize the report generator
report = LeadTimeReport("releases.db")

# Define the scope
project_keys = ["FRONTEND", "BACKEND", "MOBILE"]
start_date = date(2025, 1, 1)
end_date = date(2025, 12, 31)

# Generate a monthly report
monthly_data = report.monthly_lead_time_report(project_keys, start_date, end_date)

# Display and visualize the report
print(monthly_data)

# Create a visualization
plt = report.show_plot(monthly_data, title="2025 Monthly Lead Time", show_trend=True)
plt.savefig('lead_time_trend.png')
The full code is available on GitHub.
The report allows you to:
- Track lead time trends over months
- Compare performance across different projects
- Identify when process changes impact lead time
- Set targets based on DORA performance levels
Additionally, the project includes SQL-based outlier reports to identify issues like:
- Projects without releases
- Releases with open stories
- Stories in multiple releases
- Stories without pull requests
Conclusion
Calculating the DORA Lead Time metric provides valuable insights into your software delivery performance. By connecting data from Jira and GitHub, this approach gives you an accurate measurement that truly reflects your development process. The real power comes from using this data to identify bottlenecks and continuously improve your delivery pipeline. Whether you're aiming to move from "medium" to "high" performer status or already pursuing "elite" performance, measuring lead time is an essential step in the journey.


