


Building a YouTube Channel Analytics Dashboard with Airflow, Spark, and Grafana
Introduction In today's creator economy, YouTube content creators rely heavily on performance metrics to guide their content strategies. While YouTube's native analytics dashboard provides basic insights, it often lacks the flexibility, depth, and customization options that serious creators need. To address this limitation, I built an automated data engineering pipeline that extracts data from the YouTube API, processes it with Apache Spark, stores it in PostgreSQL, and visualizes it with Grafana. This article details my implementation of this YouTube Channel Analytics Dashboard, developed as part of the Data Engineering Easter Holiday Challenge. The solution provides content creators with deeper insights into their channel performance, audience engagement, and optimal content strategies. Problem Statement YouTube content creators face several challenges when trying to analyze their channel performance: YouTube's native dashboard offers limited flexibility and customization Manual data collection is time-consuming, error-prone, and not scalable Creators lack a centralized platform for tracking performance metrics over time Identifying optimal publishing schedules and content types requires complex analysis To solve these problems, creators need an automated analytics data pipeline that: Periodically pulls video-level performance data from the YouTube API Cleans, aggregates, and stores that data in a structured format Delivers actionable insights through intuitive visualizations Solution Architecture The solution is built as a complete ETL (Extract, Transform, Load) pipeline with visualization capabilities: The pipeline consists of the following components: Extract: A Python script that pulls channel and video data from the YouTube API v3 Transform: Apache Spark processes the extracted data and adds derived metrics Load: Processed data is stored in a PostgreSQL database Orchestrate: Apache Airflow schedules and manages the pipeline execution Visualize: Grafana dashboards provide interactive visualizations of the data All components were deployed on an Azure VM, making this a cost-effective solution for individual creators or small agencies. Implementation Details Data Extraction The extraction component uses the YouTube Data API v3 to collect channel and video data. The script handles API authentication, retrieves the channel's uploaded videos playlist, and extracts detailed metadata for each video. Here's the implementation of the extraction script: import os from googleapiclient.discovery import build from datetime import datetime import json import sys from dotenv import load_dotenv # Load variables from .env load_dotenv() # --- Configuration --- YOUTUBE_API_KEY = os.getenv("YOUTUBE_API_KEY") CHANNEL_ID = os.getenv("YOUTUBE_CHANNEL_ID") OUTPUT_FILENAME = os.getenv("OUTPUT_FILENAME") def validate_config(): if not YOUTUBE_API_KEY: print("Error: YOUTUBE_API_KEY environment variable not set.", file=sys.stderr) sys.exit(1) if not CHANNEL_ID: print("Error: YOUTUBE_CHANNEL_ID environment variable not set.", file=sys.stderr) sys.exit(1) def build_youtube_client(): return build("youtube", "v3", developerKey=YOUTUBE_API_KEY) def get_playlist_id(youtube, channel_id): try: request = youtube.channels().list(part="contentDetails", id=channel_id) response = request.execute() return response['items'][0]['contentDetails']['relatedPlaylists']['uploads'] if response['items'] else None except Exception as e: print(f"Error fetching channel details: {e}", file=sys.stderr) return None def get_video_ids(youtube, playlist_id): video_ids, next_page_token = [], None while True: try: request = youtube.playlistItems().list( part="contentDetails", playlistId=playlist_id, maxResults=50, pageToken=next_page_token ) response = request.execute() video_ids.extend([item['contentDetails']['videoId'] for item in response['items']]) next_page_token = response.get('nextPageToken') if not next_page_token: break except Exception as e: print(f"Error fetching playlist items: {e}", file=sys.stderr) break return video_ids def get_video_details(youtube, video_ids): all_video_data = [] for i in range(0, len(video_ids), 50): video_chunk = ",".join(video_ids[i:i+50]) try: request = youtube.videos().list(part="snippet,statistics", id=video_chunk) response = request.execute() timestamp = datetime.utcnow().isoformat() + 'Z' for item in response['items']: video_data = { 'videoId': item['id'], 'title': item['snippet']['title'], 'publis
Introduction
In today's creator economy, YouTube content creators rely heavily on performance metrics to guide their content strategies. While YouTube's native analytics dashboard provides basic insights, it often lacks the flexibility, depth, and customization options that serious creators need. To address this limitation, I built an automated data engineering pipeline that extracts data from the YouTube API, processes it with Apache Spark, stores it in PostgreSQL, and visualizes it with Grafana.
This article details my implementation of this YouTube Channel Analytics Dashboard, developed as part of the Data Engineering Easter Holiday Challenge. The solution provides content creators with deeper insights into their channel performance, audience engagement, and optimal content strategies.
Problem Statement
YouTube content creators face several challenges when trying to analyze their channel performance:
- YouTube's native dashboard offers limited flexibility and customization
- Manual data collection is time-consuming, error-prone, and not scalable
- Creators lack a centralized platform for tracking performance metrics over time
- Identifying optimal publishing schedules and content types requires complex analysis
To solve these problems, creators need an automated analytics data pipeline that:
- Periodically pulls video-level performance data from the YouTube API
- Cleans, aggregates, and stores that data in a structured format
- Delivers actionable insights through intuitive visualizations
Solution Architecture
The solution is built as a complete ETL (Extract, Transform, Load) pipeline with visualization capabilities:
The pipeline consists of the following components:
- Extract: A Python script that pulls channel and video data from the YouTube API v3
- Transform: Apache Spark processes the extracted data and adds derived metrics
- Load: Processed data is stored in a PostgreSQL database
- Orchestrate: Apache Airflow schedules and manages the pipeline execution
- Visualize: Grafana dashboards provide interactive visualizations of the data
All components were deployed on an Azure VM, making this a cost-effective solution for individual creators or small agencies.
Implementation Details
Data Extraction
The extraction component uses the YouTube Data API v3 to collect channel and video data. The script handles API authentication, retrieves the channel's uploaded videos playlist, and extracts detailed metadata for each video.
Here's the implementation of the extraction script:
import os
from googleapiclient.discovery import build
from datetime import datetime
import json
import sys
from dotenv import load_dotenv

# Load variables from .env
load_dotenv()

# --- Configuration ---
YOUTUBE_API_KEY = os.getenv("YOUTUBE_API_KEY")
CHANNEL_ID = os.getenv("YOUTUBE_CHANNEL_ID")
OUTPUT_FILENAME = os.getenv("OUTPUT_FILENAME")

def validate_config():
    if not YOUTUBE_API_KEY:
        print("Error: YOUTUBE_API_KEY environment variable not set.", file=sys.stderr)
        sys.exit(1)
    if not CHANNEL_ID:
        print("Error: YOUTUBE_CHANNEL_ID environment variable not set.", file=sys.stderr)
        sys.exit(1)

def build_youtube_client():
    return build("youtube", "v3", developerKey=YOUTUBE_API_KEY)

def get_playlist_id(youtube, channel_id):
    try:
        request = youtube.channels().list(part="contentDetails", id=channel_id)
        response = request.execute()
        return response['items'][0]['contentDetails']['relatedPlaylists']['uploads'] if response['items'] else None
    except Exception as e:
        print(f"Error fetching channel details: {e}", file=sys.stderr)
        return None

def get_video_ids(youtube, playlist_id):
    video_ids, next_page_token = [], None
    while True:
        try:
            request = youtube.playlistItems().list(
                part="contentDetails",
                playlistId=playlist_id,
                maxResults=50,
                pageToken=next_page_token
            )
            response = request.execute()
            video_ids.extend([item['contentDetails']['videoId'] for item in response['items']])
            next_page_token = response.get('nextPageToken')
            if not next_page_token:
                break
        except Exception as e:
            print(f"Error fetching playlist items: {e}", file=sys.stderr)
            break
    return video_ids

def get_video_details(youtube, video_ids):
    all_video_data = []
    for i in range(0, len(video_ids), 50):
        video_chunk = ",".join(video_ids[i:i+50])
        try:
            request = youtube.videos().list(part="snippet,statistics", id=video_chunk)
            response = request.execute()
            timestamp = datetime.utcnow().isoformat() + 'Z'
            for item in response['items']:
                video_data = {
                    'videoId': item['id'],
                    'title': item['snippet']['title'],
                    'publishedAt': item['snippet']['publishedAt'],
                    'viewCount': item['statistics'].get('viewCount'),
                    'likeCount': item['statistics'].get('likeCount'),
                    'commentCount': item['statistics'].get('commentCount'),
                    'extractionTimestamp': timestamp
                }
                all_video_data.append(video_data)
        except Exception as e:
            print(f"Error fetching video details: {e}", file=sys.stderr)
    return all_video_data

if __name__ == "__main__":
    print("Starting YouTube data extraction...")

    # Step 1: Validate configuration
    validate_config()

    # Step 2: Build YouTube client
    youtube = build_youtube_client()

    # Step 3: Get the uploads playlist ID
    playlist_id = get_playlist_id(youtube, CHANNEL_ID)
    if not playlist_id:
        print(f"Could not retrieve playlist ID for channel {CHANNEL_ID}.", file=sys.stderr)
        sys.exit(1)

    # Step 4: Fetch video IDs from the playlist
    video_ids = get_video_ids(youtube, playlist_id)
    if not video_ids:
        print(f"No videos found for channel {CHANNEL_ID}.", file=sys.stderr)
        sys.exit(1)

    # Step 5: Get video details
    video_data = get_video_details(youtube, video_ids)
    if not video_data:
        print("No video data fetched.", file=sys.stderr)
        sys.exit(1)

    # Step 6: Save video data to file
    try:
        with open(OUTPUT_FILENAME, 'w') as f:
            json.dump(video_data, f, indent=4)
        print(f"Data saved to {OUTPUT_FILENAME}")
    except IOError as e:
        print(f"Error writing data to {OUTPUT_FILENAME}: {e}", file=sys.stderr)
        sys.exit(1)

    print("Extraction process finished.")
    sys.exit(0)
The script follows these key steps:
- Validates environment variables and API key
- Retrieves the channel's uploads playlist ID
- Extracts all video IDs from the playlist, handling pagination
- Fetches detailed metadata for each video (in batches of 50 to respect API limits)
- Saves the raw data to a JSON file for further processing
Data Transformation and Enrichment
The transformation component uses Apache Spark to process the raw JSON data and enrich it with additional metrics. This step converts date strings to timestamps, adds temporal dimensions (year, month, day, hour), and classifies videos based on performance.
import os
import json
from pyspark.sql import SparkSession
from pyspark.sql.functions import col
from dotenv import load_dotenv

load_dotenv()

POSTGRES_USER = os.getenv("POSTGRES_USER")
POSTGRES_PASSWORD = os.getenv("POSTGRES_PASSWORD")
POSTGRES_HOST = os.getenv("POSTGRES_HOST")
POSTGRES_PORT = os.getenv("POSTGRES_PORT")
POSTGRES_DB = os.getenv("POSTGRES_DB")

# Initialize Spark Session with PostgreSQL JDBC driver
spark = SparkSession.builder \
    .appName("YouTube Data Transformation") \
    .config("spark.jars", "/path/to/postgresql-driver.jar") \
    .getOrCreate()

# Read raw JSON data
df_raw = spark.read.option("multiline", "true").json("/path/to/youtube_videos_raw.json")
df_raw.createOrReplaceTempView("youtube_videos_raw")

# Basic transformation - type conversion and filtering
sql_query = """
    SELECT
        videoId,
        title,
        publishedAt,
        CAST(viewCount AS INT) AS viewCount,
        CAST(likeCount AS INT) AS likeCount,
        CAST(commentCount AS INT) AS commentCount,
        extractionTimestamp
    FROM youtube_videos_raw
    WHERE viewCount IS NOT NULL
    ORDER BY viewCount DESC
"""
df_transformed = spark.sql(sql_query)

# Register transformed DataFrame for enrichment
df_transformed.createOrReplaceTempView("youtube_transformed")

# Enhanced enrichment - adding temporal dimensions and performance classification
enriched_query = """
    SELECT
        *,
        YEAR(TO_TIMESTAMP(publishedAt)) AS year,
        MONTH(TO_TIMESTAMP(publishedAt)) AS month,
        DAY(TO_TIMESTAMP(publishedAt)) AS day_of_month,
        DATE_FORMAT(TO_TIMESTAMP(publishedAt), 'EEEE') AS day_of_week,
        HOUR(TO_TIMESTAMP(publishedAt)) AS hour,
        WEEKOFYEAR(TO_TIMESTAMP(publishedAt)) AS week,
        CASE
            WHEN viewCount > 100000 THEN 'viral'
            WHEN viewCount > 5000 THEN 'high'
            ELSE 'normal'
        END AS performance_class
    FROM youtube_transformed
"""
df_enriched = spark.sql(enriched_query)
df_enriched.show()

# Configure PostgreSQL connection
jdbc_url = f"jdbc:postgresql://{POSTGRES_HOST}:{POSTGRES_PORT}/{POSTGRES_DB}"
connection_properties = {
    "user": POSTGRES_USER,
    "password": POSTGRES_PASSWORD,
    "driver": "org.postgresql.Driver"
}

# Save enriched data to PostgreSQL
df_enriched.write \
    .jdbc(
        url=jdbc_url,
        table="dataengineering.youtube_videos_enriched",
        mode="append",
        properties=connection_properties
    )

print("✅ Enriched data successfully appended to PostgreSQL.")
spark.stop()
The transformation script:
- Reads the raw JSON data extracted from the YouTube API
- Performs basic transformations (type casting, filtering null values)
- Enriches the data with additional dimensions:
- Temporal breakdowns (year, month, day, hour, week)
- Day of week for publishing analysis
- Performance classification based on view count thresholds
- Loads the enriched data into a PostgreSQL database
Workflow Orchestration with Airflow
To ensure the pipeline runs consistently and reliably, I used Apache Airflow to orchestrate the workflow. The DAG (Directed Acyclic Graph) defines the sequence of tasks and their dependencies:
from datetime import datetime, timedelta
from airflow import DAG
from airflow.operators.bash import BashOperator

# Default arguments
default_args = {
    "owner": "[USER_NAME]",
    "depends_on_past": False,
    "start_date": datetime(2025, 4, 23),
    "email": ["[EMAIL_ADDRESS]"],
    "email_on_failure": False,
    "email_on_retry": True,
    "retries": 2,
    "retry_delay": timedelta(minutes=1),
}

# DAG definition
with DAG(
    "youtube_analytics_pipeline",
    default_args=default_args,
    schedule_interval="@daily",
    catchup=False,
    tags=["YouTube", "Analytics", "Spark"],
) as dag:
    run_scraper = BashOperator(
        task_id="run_youtube_scraper",
        bash_command="""
        source /path/to/virtualenv/bin/activate && \
        python3 /path/to/youtube_scraper.py
        """,
    )

    run_transform = BashOperator(
        task_id="run_spark_transform",
        bash_command="""
        source /path/to/virtualenv/bin/activate && \
        python3 /path/to/spark_transform.py
        """,
    )

    run_scraper >> run_transform
The Airflow DAG:
- Runs daily, with configurable retry logic
- First executes the YouTube data extraction script
- Once extraction is complete, triggers the Spark transformation and loading process
- Provides error handling and notification capabilities
- Can be extended to include additional tasks (like data validation or report generation)
Data Visualization with Grafana
After setting up the data pipeline, I created a comprehensive Grafana dashboard to visualize the YouTube channel analytics. The dashboard addresses the key questions content creators need answered:
Key Visualizations
-
Channel Growth Overview
- Time series graph of views, likes, and comments over time
- Cumulative view count by month
- Weekly growth rate comparison
-
Top Performing Videos
- Table of highest viewed videos with title, view count, likes, and comments
- Engagement rate calculation (likes + comments / views)
- Performance classification distribution
-
Publishing Time Analysis
- Heatmap of views by day of week and hour
- Bar chart of average view count by day of week
- Pie chart of views by time of day (morning, afternoon, evening, night)
-
Audience Engagement Patterns
- Line graph tracking engagement metrics over time
- Scatter plot of video length vs. engagement rate
- Correlation between publishing frequency and view count
Here's a sample query used for the day of week performance visualization:
SELECT
  day_of_week,
  AVG(viewCount) as avg_views,
  AVG(likeCount) as avg_likes,
  AVG(commentCount) as avg_comments
FROM
  dataengineering.youtube_videos_enriched
GROUP BY
  day_of_week
ORDER BY
  CASE
    WHEN day_of_week = 'Monday' THEN 1
    WHEN day_of_week = 'Tuesday' THEN 2
    WHEN day_of_week = 'Wednesday' THEN 3
    WHEN day_of_week = 'Thursday' THEN 4
    WHEN day_of_week = 'Friday' THEN 5
    WHEN day_of_week = 'Saturday' THEN 6
    WHEN day_of_week = 'Sunday' THEN 7
  END
Data Analysis and Insights
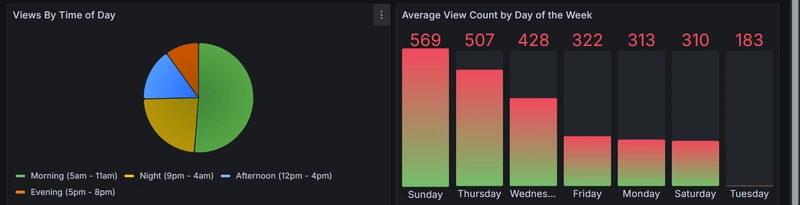
Views by Time of Day
The pie chart reveals clear viewing patterns throughout the day:
| Time Period | Audience Behavior |
|---|---|
| Morning (5am-11am) | Highest engagement - nearly half of all views |
| Night (9pm-4am) | Strong secondary viewing window |
| Afternoon (12pm-4pm) | Moderate engagement |
| Evening (5pm-8pm) | Lowest engagement period |
Day of Week Performance
The bar chart highlights significant day-to-day variations:
| Day | Avg. Views | Performance |
|---|---|---|
| Sunday | 569 | Peak performance (100%) |
| Thursday | 507 | Strong performer (89% of peak) |
| Wednesday | 428 | Good performer (75% of peak) |
| Friday | 322 | Moderate performer (57% of peak) |
| Monday | 313 | Moderate performer (55% of peak) |
| Saturday | 310 | Moderate performer (54% of peak) |
| Tuesday | 183 | Lowest performer (32% of peak) |
Content Strategy Recommendations
Based on the analytics, here are data-driven recommendations:
-
Optimal Publishing Schedule:
- Primary: Sunday mornings (5am-11am)
- Secondary: Thursday mornings (5am-11am)
- Avoid: Tuesday releases entirely
-
Content Distribution Strategy:
- Release major content on Sundays to maximize initial viewership
- Schedule promotional content on Thursdays to build weekend momentum
- Use Wednesday slots for mid-week engagement maintenance
- Consider Monday content to start the week strong
Challenges and Solutions
During the implementation of this project, I encountered several challenges:
-
API Rate Limiting
- Challenge: YouTube API has strict quotas (10,000 units per day)
- Solution: Implemented batch processing and clever quota usage by minimizing API calls
-
Data Quality Issues
- Challenge: Missing statistics fields for some videos
- Solution: Added robust error handling and null value management in the Spark transformation
Future Enhancements
While the current implementation provides valuable insights, several enhancements could further improve the analytics platform:
-
Sentiment Analysis
- Integrate comment analysis using NLP to measure audience sentiment
- Track sentiment changes over time and correlation with content topics
-
Competitor Analysis
- Add capability to benchmark performance against similar channels
- Identify content gaps and opportunities
-
Recommendation Engine
- Develop a recommendation system for optimal publishing times
- Provide content suggestions based on historical performance
-
Automated Reporting
- Implement automatic weekly/monthly reports via email
- Add anomaly detection to alert on unusual performance changes
-
Cross-Platform Integration
- Connect with other social media APIs (Twitter, Instagram, TikTok)
- Provide holistic view of content performance across platforms