


Building Financial Data Analysis with AWS: A Step-by-Step Guide
This article was first published on Medium. Check it out here: [https://medium.com/@alex.curtis_luit/grab-the-snake-by-the-tail-and-wag-it-until-you-have-something-useful-a110c108fc53]. Grab the snake by the tail and wag it until you have something useful! Building a Financial Data Analysis and Reporting Tool with Python The answer is in the question….shake the Python until you get something useful…are you ready? In today’s data-driven world, having the right tools to analyze financial data is crucial for decision-making. As part of my ongoing journey in the cloud and DevOps space, I recently created a Python script that fetches market data for stocks and cryptocurrencies, calculates key technical indicators, and generates a comprehensive financial report in PDF format. In this article, I’ll Walk you through the code I built, its features, and how you can use it to analyze financial market data with Python. Overview of the Project This project pulls market data from Yahoo Finance for various tickers (stocks and cryptocurrencies), computes technical indicators like moving averages and Bollinger Bands, and finally outputs the results in a PDF report. The aim is to provide a one-stop tool for both individual investors and professionals to track the performance of various assets and gain insights into market trends. Key Features: Data Fetching: The script retrieves historical data for stocks and cryptocurrencies. * The cool thing is you can modify it as you see fit! Technical Analysis: It calculates standard technical indicators such as the 20-day moving average and Bollinger Bands. PDF Report Generation: The data and analysis are compiled into a PDF file for easy sharing and viewing. Code Breakdown Let’s walk through the key sections of the code and understand how they work. Fetching Financial Data We use the yfinance library to fetch market data for a list of tickers. Yahoo Finance provides historical price data for various financial assets, including stocks, indices, and cryptocurrencies. import yfinance as yf def fetch_and_process_data(ticker): print(f"Fetching data for {ticker}...") df = yf.download(ticker, period="1y", interval="1d") return df Here, the fetch_and_process_data function takes a ticker symbol (e.g., "AAPL" for Apple or "BTC-USD" for Bitcoin) and downloads one year of daily historical data. Calculating Technical Indicators Once we have the data, we perform some technical analysis. For example, we calculate the Rolling Standard Deviation to analyze price volatility and Bollinger Bands to evaluate price movements relative to a moving average. What does all of this mean? Rolling Standard Deviation = Measures how much the price is jumping around. import pandas as pd def calculate_technical_indicators(df): # Calculate rolling standard deviation (volatility) df['rolling_std'] = df['Close'].rolling(window=20).std() # Calculate Bollinger Bands df['UpperBand'] = df['Close'].rolling(window=20).mean() + 2 * df['rolling_std'] df['LowerBand'] = df['Close'].rolling(window=20).mean() - 2 * df['rolling_std'] # Fill any missing values with 'N/A' df.fillna("N/A", inplace=True) return df In this section, we compute a 20-day rolling standard deviation and use it to calculate the upper and lower Bollinger Bands. Bollinger Bands are used to identify overbought or oversold conditions in an asset. Generating the PDF Report Once the data is processed and the indicators are calculated, we generate a PDF report using the fpdf library. This report includes the asset's closing price, the calculated technical indicators, and charts for visual representation. from fpdf import FPDF def generate_pdf(tickers): pdf = FPDF() pdf.set_auto_page_break(auto=True, margin=15) pdf.add_page() for ticker in tickers: df = fetch_and_process_data(ticker) df = calculate_technical_indicators(df) # Write the ticker symbol and the technical indicators to the PDF pdf.set_font("Arial", size=12) pdf.cell(200, 10, txt=f"Technical Report for {ticker}", ln=True) # Add data to the PDF (this is just an example for the first 5 rows) for index, row in df.head().iterrows(): pdf.cell(200, 10, txt=f"{index}: {row['Close']} - UpperBand: {row['UpperBand']} - LowerBand: {row['LowerBand']}", ln=True) pdf.output("fintech_market_data.pdf") print("PDF generated successfully: fintech_market_data.pdf") The generate_pdf function adds the processed financial data (including stock prices and technical indicators) to the PDF file. You can extend this part to add more visualizations, such as charts or graphs, to make the report even more insightful. Handling Data Quality We also handle missing data by filling it with “N/A”. This ensures the script doesn’t break when data is missing for any particular day. df.fillna("N/A", inplace=True) This approach prevents errors fro
This article was first published on Medium. Check it out here: [https://medium.com/@alex.curtis_luit/grab-the-snake-by-the-tail-and-wag-it-until-you-have-something-useful-a110c108fc53].
Grab the snake by the tail and wag it until you have something useful!
Building a Financial Data Analysis and Reporting Tool with Python
The answer is in the question….shake the Python until you get something useful…are you ready?
In today’s data-driven world, having the right tools to analyze financial data is crucial for decision-making. As part of my ongoing journey in the cloud and DevOps space, I recently created a Python script that fetches market data for stocks and cryptocurrencies, calculates key technical indicators, and generates a comprehensive financial report in PDF format.
In this article, I’ll Walk you through the code I built, its features, and how you can use it to analyze financial market data with Python.
Overview of the Project
This project pulls market data from Yahoo Finance for various tickers (stocks and cryptocurrencies), computes technical indicators like moving averages and Bollinger Bands, and finally outputs the results in a PDF report. The aim is to provide a one-stop tool for both individual investors and professionals to track the performance of various assets and gain insights into market trends.
Key Features:
Data Fetching: The script retrieves historical data for stocks and cryptocurrencies. * The cool thing is you can modify it as you see fit!
Technical Analysis: It calculates standard technical indicators such as the 20-day moving average and Bollinger Bands.
PDF Report Generation: The data and analysis are compiled into a PDF file for easy sharing and viewing.
Code Breakdown
Let’s walk through the key sections of the code and understand how they work.
- Fetching Financial Data
We use the yfinance library to fetch market data for a list of tickers. Yahoo Finance provides historical price data for various financial assets, including stocks, indices, and cryptocurrencies.
import yfinance as yf

def fetch_and_process_data(ticker):
    print(f"Fetching data for {ticker}...")
    df = yf.download(ticker, period="1y", interval="1d")
    return df
Here, the fetch_and_process_data function takes a ticker symbol (e.g., "AAPL" for Apple or "BTC-USD" for Bitcoin) and downloads one year of daily historical data.
- Calculating Technical Indicators Once we have the data, we perform some technical analysis. For example, we calculate the Rolling Standard Deviation to analyze price volatility and Bollinger Bands to evaluate price movements relative to a moving average.
What does all of this mean?
Rolling Standard Deviation = Measures how much the price is jumping around.
import pandas as pd

def calculate_technical_indicators(df):
    # Calculate rolling standard deviation (volatility)
    df['rolling_std'] = df['Close'].rolling(window=20).std()

    # Calculate Bollinger Bands
    df['UpperBand'] = df['Close'].rolling(window=20).mean() + 2 * df['rolling_std']
    df['LowerBand'] = df['Close'].rolling(window=20).mean() - 2 * df['rolling_std']

    # Fill any missing values with 'N/A'
    df.fillna("N/A", inplace=True)

    return df
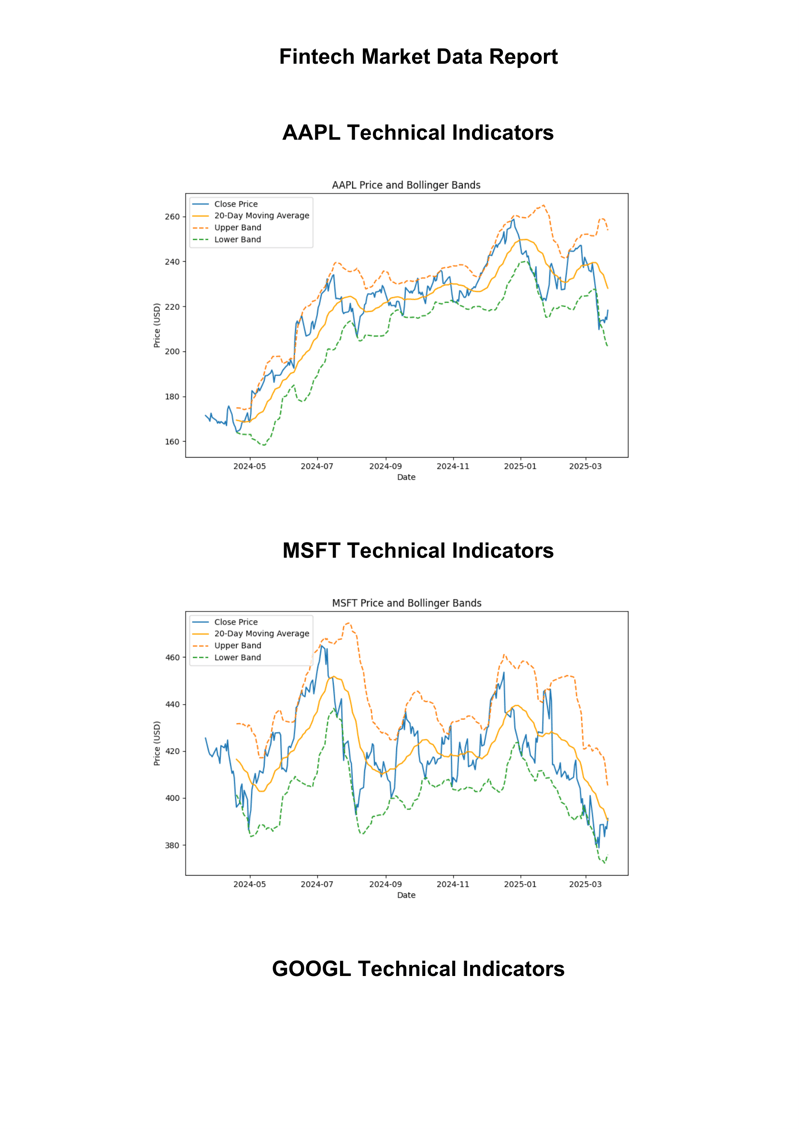
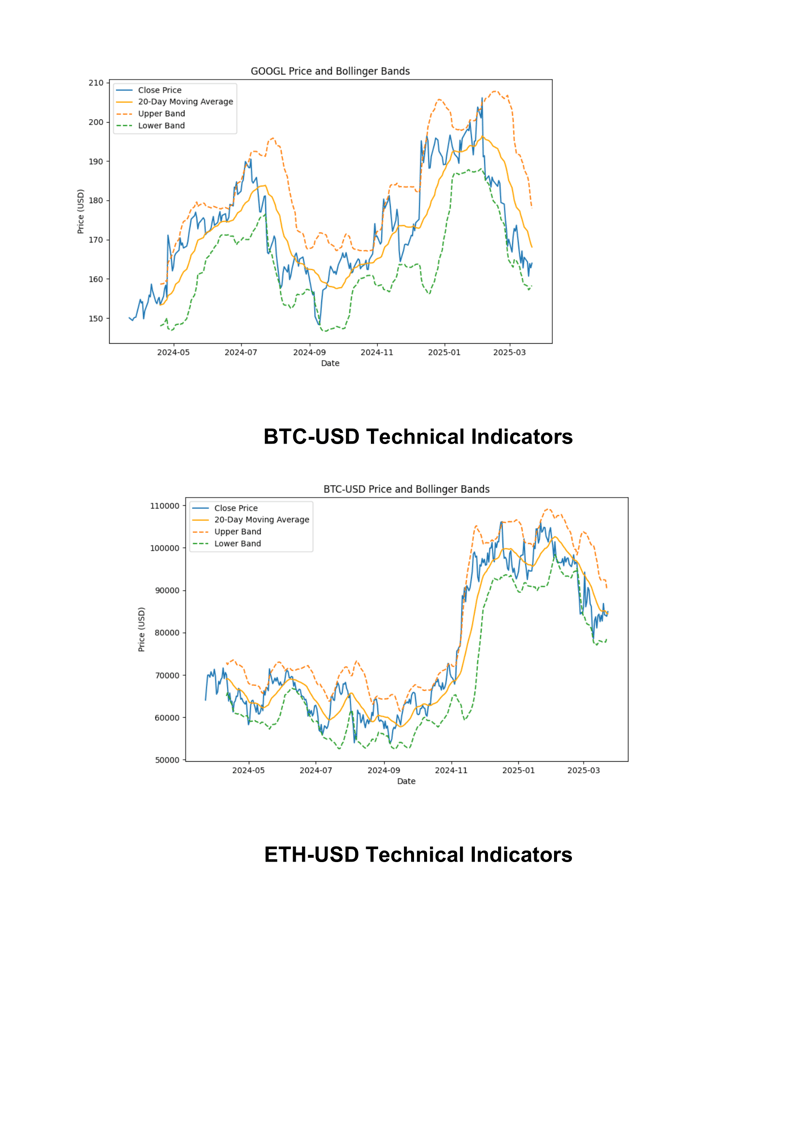
In this section, we compute a 20-day rolling standard deviation and use it to calculate the upper and lower Bollinger Bands. Bollinger Bands are used to identify overbought or oversold conditions in an asset.
- Generating the PDF Report Once the data is processed and the indicators are calculated, we generate a PDF report using the fpdf library. This report includes the asset's closing price, the calculated technical indicators, and charts for visual representation.
from fpdf import FPDF

def generate_pdf(tickers):
    pdf = FPDF()
    pdf.set_auto_page_break(auto=True, margin=15)
    pdf.add_page()

    for ticker in tickers:
        df = fetch_and_process_data(ticker)
        df = calculate_technical_indicators(df)

        # Write the ticker symbol and the technical indicators to the PDF
        pdf.set_font("Arial", size=12)
        pdf.cell(200, 10, txt=f"Technical Report for {ticker}", ln=True)

        # Add data to the PDF (this is just an example for the first 5 rows)
        for index, row in df.head().iterrows():
            pdf.cell(200, 10, txt=f"{index}: {row['Close']} - UpperBand: {row['UpperBand']} - LowerBand: {row['LowerBand']}", ln=True)

    pdf.output("fintech_market_data.pdf")
    print("PDF generated successfully: fintech_market_data.pdf")
The generate_pdf function adds the processed financial data (including stock prices and technical indicators) to the PDF file. You can extend this part to add more visualizations, such as charts or graphs, to make the report even more insightful.
- Handling Data Quality We also handle missing data by filling it with “N/A”. This ensures the script doesn’t break when data is missing for any particular day.
df.fillna("N/A", inplace=True)
This approach prevents errors from occurring when we try to display or process the data further.
Running the Script
Once the script is set up and ready, you simply need to run the main function, which pulls data for each ticker, performs the analysis, and generates the PDF:
def main():
    tickers = ["AAPL", "MSFT", "GOOGL", "BTC-USD", "ETH-USD"]
    generate_pdf(tickers)

if __name__ == "__main__":
    main()
Output
When you run the script, it will download market data for the tickers you specify (Apple, Microsoft, Google, Bitcoin, and Ethereum in this case). It will then generate a PDF file named fintech_market_data.pdf, which contains the financial analysis for each asset, including the calculated technical indicators.
Conclusion
This project is a great starting point for building more advanced financial tools. You can enhance the script further by adding more technical indicators, integrating machine learning models for predictions, or even pushing the data to a cloud platform for real-time analysis.
With Python and a few powerful libraries like yfinance, pandas, and fpdf, you can create powerful financial tools that provide valuable insights. I hope this article inspires you to experiment with financial data analysis and see how Python can simplify the process.
AWS
AWSCommunity
AWSCommunityBuilder
Thanks to @jasondunn @chriscampbell96