


/https://tf-cmsv2-smithsonianmag-media.s3.amazonaws.com/filer_public/89/1e/891e92d0-6728-47c3-b935-f279f604f40c/gettyimages-1962575656_web.jpg?#)


Balancing Memory Heap and Performance in Gradle Builds
In this post, we analyze the impact of different memory heap configurations on the performance of a given project. A common assumption is that increasing memory heap allocation improves build performance. However, in this article, we evaluate various metrics to determine the actual effects of different memory settings. Experiment Setup The setup for this experiment is straightforward. The free GitHub Actions runners provide a maximum of 16 GB of memory. Our build process, which involves running assembleDebug on nowinandroid, consists of two main components: The Gradle process The Kotlin compiler process To analyze the impact of memory allocation, we define several configurations within the range of 2.5 GB to 7 GB, increasing in 1 GB increments. The minimum of 2.5 GB was chosen because a 2 GB allocation resulted in an OutOfMemory error. The tested configurations are: 2.5 GB 3 GB 4 GB 5 GB 6 GB 7 GB These values are set using the following JVM arguments in gradle.properties: org.gradle.jvmargs=-Xmx{$VARIANT}g -Xms{$VARIANT}g ... kotlin.daemon.jvmargs=-Xmx{$VARIANT}g -Xms{$VARIANT}g ... We use the same configuration as nowinandroid, where Xmx and Xms values are identical, and the G1 garbage collector is enabled. Methodology Each configuration is executed 20 times on clean agents, with dependencies preloaded in the Gradle user home. Each iteration generates a build scan, which is later analyzed using the Develocity API. Results Build Time The first metric we evaluate is the overall build time for each memory configuration. A key observation is that there is no clear correlation between increasing heap allocation and reducing build time. Additionally, the low standard deviation suggests that median build times are similar across configurations. Below is a breakdown of the median build times per configuration: Maximum Memory Usage Develocity provides resource usage data in the build scans, we analyze the maximum memory usage of the build process. The results align well with the allocated memory configurations: We observe a linear increase in memory usage up to 4 GB. However, for larger allocations, variance increases, suggesting that the Gradle process might be overconfigured in scenarios with 6 GB or 7 GB. Kotlin Compiler Memory Usage Next, we examine memory usage for the Kotlin compiler process: The data here is more scattered. We did not perform a detailed analysis of this variance. From this point onward, we focus on Gradle process data. Garbage Collection Time Now, we analyze Gradle's garbage collection (GC) time across all observations: For a clearer comparison, we examine the median GC times: Configurations with 2.5 GB and 3 GB allocations exhibit significantly higher GC times. The differences between larger configurations are much smaller. Garbage Collections events For additional insights, we use the GC Report Plugin, which logs information about garbage collections during build execution. The first metric to analyze is the aggregated number of collections(excluding Concurrent Mark Cycle): Variants with 2.5 GB and 3 GB experience a significantly higher number of GC events. As memory allocation increases, the number of collections decreases, but the reduction is not linear. Next, we analyze Pause Young (Normal) (G1 Evacuation Pause) events. These pauses occur when application threads stop while objects in the young generation are collected and moved to either survivor spaces or the old generation: When examining other factors, such as Humongous objects (Normal), we observe that only the 2.5 GB variant has these entries, Showing short memory state for this variant. More interestingly, we analyze Pause Young (Concurrent Start) (G1 Humongous Allocation) events. These occur when the JVM anticipates old-generation GC pressure and preemptively starts a concurrent cycle—an indicator that memory pressure is increasing: Here, lower-memory configurations trigger more collections of this type. Starting at 5 GB, configurations show more stability, with the median value stabilizing at one event per iteration. Final words This article analyzed the behavior of the Gradle process under different heap configurations. Key findings include: Increasing memory allocation does not significantly improve build duration in this project. Maximum memory usage shows slight variance at higher allocations (6 GB and 7 GB). Larger heap allocations reduce GC time, but the difference is not substantial. The number of GC collections decreases with higher allocations, stabilizing around 5 GB. G1 Humongous Allocation events suggest that configurations with 5 GB or more are better optimized. Based on these findings, CI environments should balance memory allocation to optimize performance while minimizing resource usage. A 4 GB or 5 GB allocation appears to offer the best trade-off betwe
In this post, we analyze the impact of different memory heap configurations on the performance of a given project. A common assumption is that increasing memory heap allocation improves build performance. However, in this article, we evaluate various metrics to determine the actual effects of different memory settings.
Experiment Setup
The setup for this experiment is straightforward. The free GitHub Actions runners provide a maximum of 16 GB of memory. Our build process, which involves running assembleDebug on nowinandroid, consists of two main components:
- The Gradle process
- The Kotlin compiler process
To analyze the impact of memory allocation, we define several configurations within the range of 2.5 GB to 7 GB, increasing in 1 GB increments. The minimum of 2.5 GB was chosen because a 2 GB allocation resulted in an OutOfMemory error.
The tested configurations are:
- 2.5 GB
- 3 GB
- 4 GB
- 5 GB
- 6 GB
- 7 GB
These values are set using the following JVM arguments in gradle.properties:
org.gradle.jvmargs=-Xmx{$VARIANT}g -Xms{$VARIANT}g ...
kotlin.daemon.jvmargs=-Xmx{$VARIANT}g -Xms{$VARIANT}g ...
We use the same configuration as nowinandroid, where Xmx and Xms values are identical, and the G1 garbage collector is enabled.
Methodology
Each configuration is executed 20 times on clean agents, with dependencies preloaded in the Gradle user home. Each iteration generates a build scan, which is later analyzed using the Develocity API.
Results
Build Time
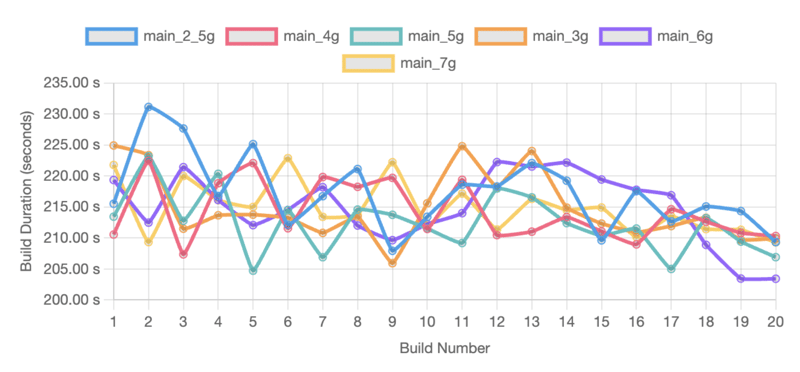
The first metric we evaluate is the overall build time for each memory configuration.
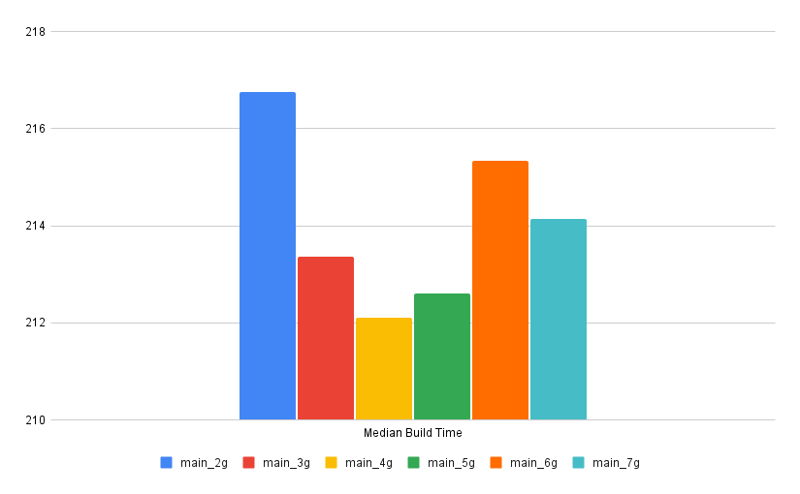
A key observation is that there is no clear correlation between increasing heap allocation and reducing build time. Additionally, the low standard deviation suggests that median build times are similar across configurations. Below is a breakdown of the median build times per configuration:
Maximum Memory Usage
Develocity provides resource usage data in the build scans, we analyze the maximum memory usage of the build process. The results align well with the allocated memory configurations:
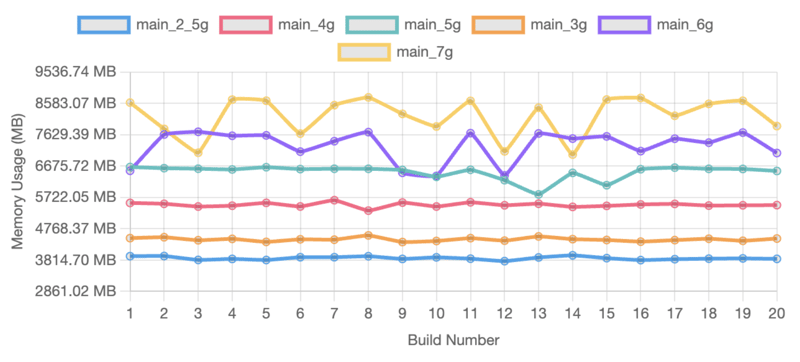
We observe a linear increase in memory usage up to 4 GB. However, for larger allocations, variance increases, suggesting that the Gradle process might be overconfigured in scenarios with 6 GB or 7 GB.
Kotlin Compiler Memory Usage
Next, we examine memory usage for the Kotlin compiler process:
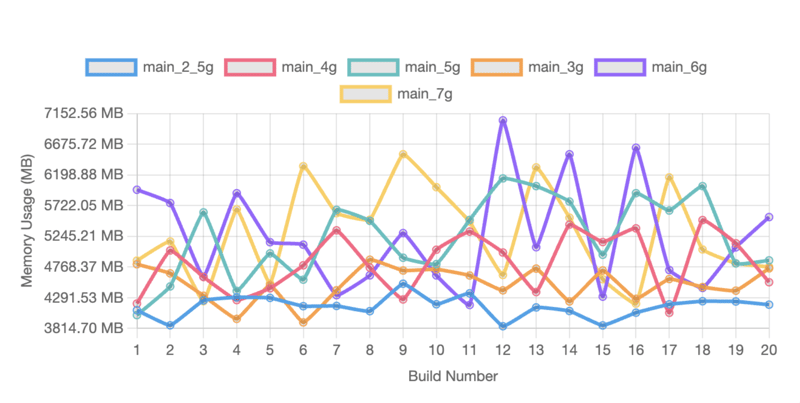
The data here is more scattered. We did not perform a detailed analysis of this variance. From this point onward, we focus on Gradle process data.
Garbage Collection Time
Now, we analyze Gradle's garbage collection (GC) time across all observations:
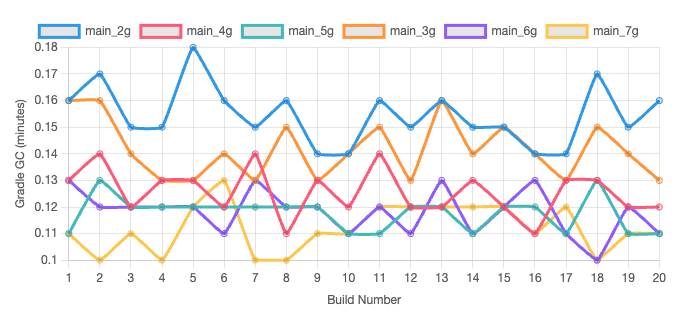
For a clearer comparison, we examine the median GC times:
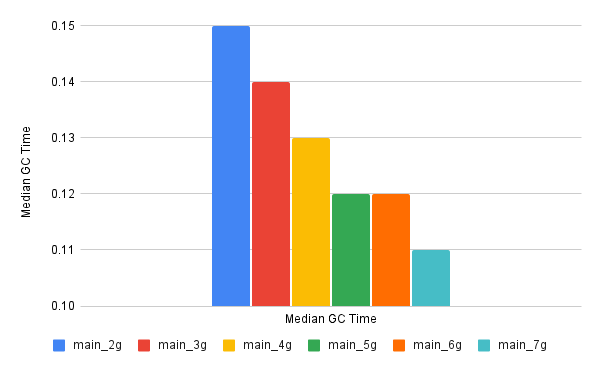
Configurations with 2.5 GB and 3 GB allocations exhibit significantly higher GC times. The differences between larger configurations are much smaller.
Garbage Collections events
For additional insights, we use the GC Report Plugin, which logs information about garbage collections during build execution. The first metric to analyze is the aggregated number of collections(excluding Concurrent Mark Cycle):

- Variants with 2.5 GB and 3 GB experience a significantly higher number of GC events.
- As memory allocation increases, the number of collections decreases, but the reduction is not linear.
Next, we analyze Pause Young (Normal) (G1 Evacuation Pause) events. These pauses occur when application threads stop while objects in the young generation are collected and moved to either survivor spaces or the old generation:
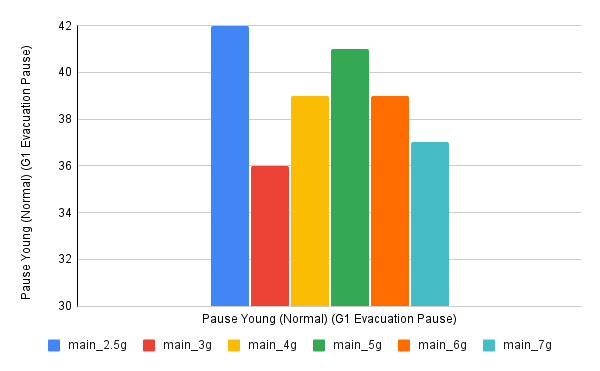
When examining other factors, such as Humongous objects (Normal), we observe that only the 2.5 GB variant has these entries, Showing short memory state for this variant.
More interestingly, we analyze Pause Young (Concurrent Start) (G1 Humongous Allocation) events. These occur when the JVM anticipates old-generation GC pressure and preemptively starts a concurrent cycle—an indicator that memory pressure is increasing:
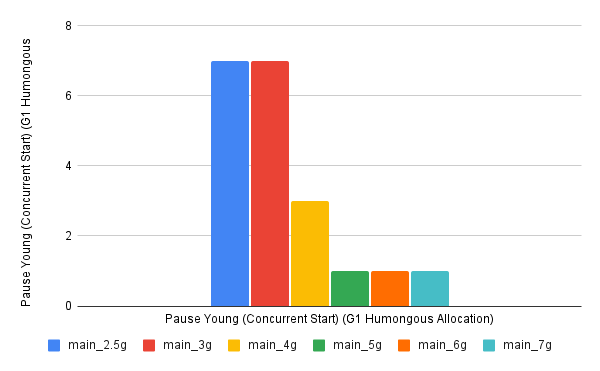
Here, lower-memory configurations trigger more collections of this type. Starting at 5 GB, configurations show more stability, with the median value stabilizing at one event per iteration.
Final words
This article analyzed the behavior of the Gradle process under different heap configurations. Key findings include:
Increasing memory allocation does not significantly improve build duration in this project.
Maximum memory usage shows slight variance at higher allocations (6 GB and 7 GB).
Larger heap allocations reduce GC time, but the difference is not substantial.
The number of GC collections decreases with higher allocations, stabilizing around 5 GB.
G1 Humongous Allocation events suggest that configurations with 5 GB or more are better optimized.
Based on these findings, CI environments should balance memory allocation to optimize performance while minimizing resource usage. A 4 GB or 5 GB allocation appears to offer the best trade-off between build performance and memory efficiency.
Happy building!
![From hating coding to programming satellites at age 37 with Francesco Ciulla [Podcast #165]](https://cdn.hashnode.com/res/hashnode/image/upload/v1742585568977/09b25b8e-8c92-4f4b-853f-64b7f7915980.png?#)